
 This page is not fully translated, yet. Please help completing the translation.
(remove this paragraph once the translation is finished)
RIQA-Camera Distortion Module
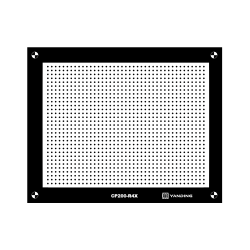
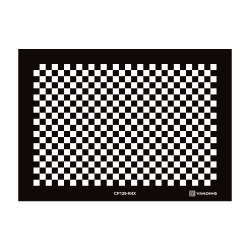
Distortion is a geometric aberration in optical systems (such as lenses) where the magnification varies across different positions in the field of view, causing the true geometric shape of the subject to be distorted in the image (e.g., straight lines becoming curved). This module supports automatic distortion analysis for dot charts and checkerboard charts.
Test Charts Supported by the Distortion Module
| Dot | Checkerboard | Concentric Test Card |
 |  |  |
DOT
Operation Steps
(1) Open the software and select “Dot” in the “Distortion” module.
 (2) Click “Add” to import the images to be analyzed.

 (3) Select the image and click “Start” to proceed to the next step.
 (4) View the analysis results.
 (5) Click “Generate Report”, enter the file name, select the save directory and file format, and click “Export” to view the saved report in the specified path.

 Result Interpretation

| Metric | Definition |
| Rotation Angle(°) | Rotation angle |
| Distortion SMIA(%) | SMIA TV distortion percentage |
| Image Radius(pixel) | Half of the diagonal length |
| Dot Number | Number of dots |
| Max LCA(pixel) | Maximum lateral chromatic aberration in pixels |
| Max LCA@0.7F(pixel) | Maximum lateral chromatic aberration at 70% field in pixels |
| Max LCA(%) | Maximum lateral chromatic aberration as a percentage |
| Max LCA@0.7F(%) | Maximum lateral chromatic aberration at 70% field as a percentage |
| Optical Distortion(%) | Optical distortion percentage |
(1) Optical and SMIA TV Distortion Curves
 The red crosses represent the actual measurement results, the blue curve represents the best-fit optical distortion curve using the least squares method, and the green curve represents the best-fit SMIA TV distortion curve using the least squares method. If the maximum distortion percentage is positive, the image exhibits pincushion distortion; if it is negative, the image exhibits barrel distortion.
(2) Grid Distortion Visualization
 Optical distortion is illustrated by comparing it with an ideal undistorted grid. Superimposed on the image is an undistorted Cartesian grid. Thin green lines connect the centers of the distorted dots to the centers of their corresponding undistorted points.
(3) Lateral Chromatic Aberration
 The aberration is summarized by three metrics: the pixel difference between the red and green channels, the pixel difference between the blue and green channels, and the pixel difference between the red and blue channels. The measured data and the best-fit model are displayed. According to CPIQ, the values are expressed in pixels and as a percentage of the image height.
Checkerboard
Operation Steps
(1) Open the software and select “Checkerboard” in the “Distortion” module.
 (2) Click “Add” to import the images to be analyzed.

 (3) Select the image, specify the number of columns and rows of the checkerboard, and click “Start” to proceed to the next step.
 (4) View the analysis results.
 (5) Click “Generate Report”, enter the file name, select the save directory and file format, and click “Export” to view the saved report in the specified path.

Result Interpretation
Click to view
Concentric Test Chart
Operation Steps
(1) Open the software and select “Concentric Test Chart” in the “Distortion” module.
 (2) Click “Add” to import the images to be analyzed.

 (3) Select the image and click “Start” to proceed to the next step.
 (4) View the analysis results.
 (5) Click “Generate Report”, enter the file name, select the save directory and file format, and click “Export” to view the saved report in the specified path.
 Result Interpretation
Segmented Distortion Plot: The distortion circle test measures the average distortion rate in various directions along the concentric circles.

 Segment(i) refers to dividing the concentric circles into eight equal parts using eight straight lines and calculating the distortion rate along each line (i.e., in each direction). For example, Segment 1 refers to the distortion value in the first of the eight divided regions, and Segment 2 refers to the distortion value in the second region.