
CMS Depth of Field
I.Definition
Depth of Field (DoF) of a CMS (Camera–Monitor System) refers to the object-distance range behind the vehicle over which targets can be sharply imaged.
In optical imaging, object points outside the focal plane produce defocused blur on the image sensor, typically described by the circle of confusion (CoC). When the CoC exceeds an acceptable threshold, the resulting blur surpasses the critical limit for clear recognition, making reliable target identification impossible.
 |
| Fig. 1: Optical diagram of circle of confusion formation, showing how out - of - focus points create blur on the image plane. |
Conventional photography sets the allowable CoC based on human visual criteria. In contrast, the CMS industry adopts MTF10 as an objective quantitative criterion. It converts the boundary of perceived image clarity into a computable metric, allowing the resolution at different object distances across the entire depth range to be quantitatively evaluated, thereby verifying whether the system complies with vehicle-mounted regulatory requirements.
 |
| Fig. 2: Real - world CMS display comparison at 4m and 10m, highlighting resolution degradation with distance. |
II.Measurement Requirements
Per regulatory standard ISO 16505, Camera-Monitor Systems (CMS) shall meet specified \(MTF10_{(1:1)}\) resolution thresholds at different object distances, to ensure drivers can clearly identify rear surrounding targets.
- For Target Point 1 (10 m, simulating infinity) and Target Point 2 (6 m, representing mid-range object distance):
$$MTF10_{(1:1)} \geq 0.9^*MTF10_{MIN(1:1)} \left[ \text{LW/PH} \right]\tag{1}$$
- For Target Point 3 (4 m, representing near-range object distance):
$$MTF10_{(1:1)} \geq \frac{1}{2} MTF10_{MIN(1:1)} \left[ \text{LW/PH} \right]]\tag{2}$$
where:
- $MTF10_{(1:1)}$ is the measured spatial frequency, defined as the spatial frequency (in LW/PH) at which the average modulation transfer function (MTF) of an electronic mirror system (CMS) in a 1:1 aspect ratio display decreases to 10% of the black-and-white reference modulation. It reflects the actual resolution performance of the CMS.
- $MTF10_{MIN(1:1)}$ is the minimum required spatial frequency. It is derived from the regulated field of view of conventional optical rear-view mirrors and human visual acuity, and it represents the resolution threshold that a CMS must meet.
- $\text{MTF10}_\text{MIN}(1:1)/\text{hor}$ is calculated as follows:
$$ MTF10_{\mathrm{MIN}(1:1)/\mathrm{hor}} = \left( \frac{W_{\mathrm{monitor}/\mathrm{hor}}}{W_{\mathrm{monitor}/\mathrm{hor}/\mathrm{min}}} \right) \cdot M_{\mathrm{mirror}/\mathrm{avg}} \cdot \alpha_{\mathrm{mirror}/\mathrm{hor}/\mathrm{min}} \cdot V_{\mathrm{eye}/\mathrm{min}} \cdot 60\,\frac{\mathrm{arcmin}}{^\circ} \tag{3} $$
- $\text{MTF10}_\text{MIN}(1:1)/\text{ver}$ is calculated as follows:
$$ MTF10_{\mathrm{MIN}(1:1)/\mathrm{ver}} = \left( \frac{H_{\mathrm{monitor}/\mathrm{ver}}}{H_{\mathrm{monitor}/\mathrm{ver}/\mathrm{min}}} \right) \cdot M_{\mathrm{mirror}/\mathrm{avg}} \cdot \alpha_{\mathrm{mirror}/\mathrm{ver}/\mathrm{min}} \cdot V_{\mathrm{eye}/\mathrm{min}} \cdot 60\,\frac{\mathrm{arcmin}}{^\circ} \tag{4} $$
where:
- The base term \(M_{\text{mirror}/\text{avg}} \cdot \alpha_{\text{mirror}/\text{min}} \cdot V_{\text{eye}/\text{min}} \cdot 60\,\dfrac{\text{arcmin}}{^\circ}\) (horizontal) and \(M_{\text{mirror}/\text{avg}} \cdot \alpha_{\text{mirror}/\text{min}} \cdot V_{\text{eye}/\text{min}} \cdot 60\,\dfrac{\text{arcmin}}{^\circ}\) (vertical) are derived from the field-of-view regulatory requirements of conventional rearview mirrors and human visual resolution capability.
- \(\dfrac{W_{\text{monitor}/\text{hor}}}{W_{\text{monitor}/\text{hor}/\text{min}}}\) and \(\dfrac{H_{\text{monitor}/\text{ver}}}{H_{\text{monitor}/\text{ver}/\text{min}}}\) are display size correction factors. They compensate for differences between the nominal monitor dimensions and the actual dimensions required to present the specified field of view. For distortion-free systems with constant magnification, these correction factors can be approximated by \(\dfrac{\alpha_{\text{monitor}}}{\alpha_{\text{mirror}/\text{min}}}\).
Test Method:
Environment Setup:
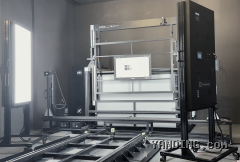
 Fig. 2: Depth of Field Test Environment Setup
Actual Scene:
 Position the CMS camera so that its optical axis is perpendicular to the hyperbolic resolution chart (as shown in Fig. 3). For vertical resolution measurement, center the chart vertically on the monitor and rotate it so that the lines appear horizontal. For horizontal resolution measurement, center the chart horizontally on the monitor and rotate it so that the lines appear vertical. The distance from the camera entrance pupil to the chart (d) should not exceed 6 m when the focal length is less than 6 m. Ensure proper exposure of the chart image without over- or underexposure.
Test equipment
Accurate and stable test results rely on a standardized test system. Yanding’s CMS Automated Test System strictly complies with international and domestic regulations such as ISO 16505 and GB 15084. High-precision, high-efficiency hardware and our in-house developed RIQA image quality analysis software enable standardized quantitative evaluation of CMS depth of field.

The core setup includes:
| Hyperbolic Test Chart | Motorized linear guide | Upright LED Light Source | RIQA Analysis Software |
|---|---|---|---|
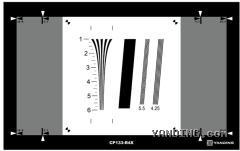 |  |  |  |
| Compliant with ISO 16505 Standard 18% Reflective Neutral Gray Background 40:1 Black and White Contrast Supports 16:9 and 4:3 Aspect Ratios | High-Precision Programmable Control Automatic Test Distance Switching (4 m / 6 m / 10 m) | Variable color temp & illuminance simulation 2,300 K-10,000 K adjustable color temperature Integrated dual IR bands (850 nm / 940 nm) | Compliant with ISO 16505 / UNECE R46 / GB 15084 Standards Covers 15+ Key Test Indicators Supports Chinese & English Bilingual Interface One-Click Test Report Generation |
Operation Procedure
Camera side
1. Switch the chart to the depth-of-field chart.
2. Turn on the fill light source, adjust the illumination level, and set the color temperature to 6500 K.
3. Adjust the camera so that its optical axis is perpendicular to the chart and the chart is centered in the image. The camera may be oriented to capture resolution in different directions.
4 Adjust the distance between the camera and the chart, and capture images at 4 m, 6 m, and 10 m.
 For wide-angle mirrors replacing a curvature radius \(r \le 400\text{ mm}\), the measurement at 10 m may be omitted. If the focal length is less than 6 m, the distance \(d\) from the camera entrance pupil to the chart shall be \(\le 6\text{ m}\).
Monitor side:
1. Set the capture lens of the imaging luminance meter perpendicular to the monitor.
2.  Turn off other light sources to ensure the ambient luminance on the monitor side is below 10 lx.
3.  Capture images using a imaging luminance meter.
Analysis and Interpretation:
Use RIQA Software (an image quality software independently developed by Yanding) to analyze the test samples.

 The depth of field results require determining whether the $MTF10$ meets regulatory requirements. MTF10 (P*K) is calculated based on the visually determined position of blurred line pairs (P value) combined with the coefficient K. As long as this value meets the standard, the sample complies with regulatory requirements.