
 This page is not fully translated, yet. Please help completing the translation.
(remove this paragraph once the translation is finished)
MTF/SFR Measurement — Siemens Star Method
Principle:
Based on the radial frequency gradient characteristics of radial sinusoidal wedge patterns, this method directly obtains the modulation MTF values at different spatial frequencies through pixel reading, sinusoidal curve fitting, and modulation calculation (without the need for Fourier transform). It then plots the MTF curve to reflect the contrast transfer capability of the imaging system at different frequencies.
(1) Pixel Reading
Locate the center of the star chart and divide it into 8 equal-angle sectors. Within each sector, read the grayscale values pixel by pixel along the radial direction from the center outward at different radii, thereby covering imaging data in all directions.

(2) Sinusoidal Curve Fitting
Fit the collected pixel grayscale values at different angles and radii into sinusoidal curves.

(3) Modulation Calculation
Based on the fitted sinusoidal curves, extract the maximum grayscale value ($I_{Max}$) and the minimum grayscale value ($S_{Min}$) to calculate the modulation:
$Modulation = \frac{I_{\text{max}} - I_{\text{min}}}{I_{\text{max}} + I_{\text{min}}}$. Then, map the modulation at different radii (corresponding to different spatial frequencies) to the spatial frequencies to obtain the MTF curve.

Advantages:
Resistant to interference from image sharpening algorithms, capable of reflecting true optical performance even without RAW data;
The periodicity of the stripes reduces the impact of noise, resulting in high measurement repeatability and suitability for batch testing;
Enables simultaneous multi-directional MTF measurement, suitable for evaluating lens anisotropy.
Limitations:
The high contrast of radial sinusoidal stripes can easily lead to sensor pixel saturation, causing non-linear errors in tonal response and thereby exaggerating MTF results;
Requires a large image area to cover the full radius of the star chart, resulting in lower spatial utilization efficiency compared to the slanted-edge method;
When used with ultra-high-resolution cameras (>10MP), the high-frequency precision limitations of the chart manufacturing process can easily introduce measurement distortions.
Test Chart:
Required to comply with the ISO 12233:2014 standard, with the inner circle diameter being 1/20 of the outer circle diameter to improve positioning accuracy; the sinusoidal stripe contrast is approximately 50:1 to 250:1, which is insensitive to the sharpening algorithms of the imaging system and avoids false high resolution; equipped with positioning markers (mark points) to support ROI positioning, and includes grayscale patches for gamma calculation; imaging must be full-field without cropping, and the number of cycles (the number of black-and-white stripe pairs) must be selected according to the camera resolution — 72 cycles for megapixel-level and 144 cycles for ten-megapixel-level.
The Yanding CP137 reflective Siemens star chart is recommended, as it meets the above chart requirements:
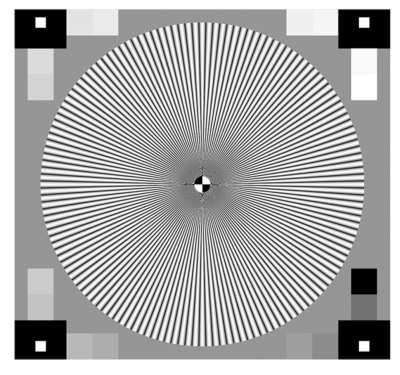 The chart specifications are as follows:
 The appropriate number of cycles must be selected based on the resolution of the module under test, and the appropriate chart magnification must be selected based on the field of view of the module under test.
This test chart supports use with the RIQA Camera image quality analysis software: