
 This page is not fully translated, yet. Please help completing the translation.
(remove this paragraph once the translation is finished)
Distortion
1. What is Distortion?
Distortion refers to the geometric distortion of the image formed by an optical system relative to the object itself. It is caused by the inconsistency of lateral magnification between the edge and the center of the lens. Distortion only alters the spatial geometry of the object and does not affect the sharpness (resolution) of the image.
Main Types:
 Barrel Distortion: The lateral magnification at the edges is less than at the center, causing straight lines to bulge outward. It is commonly seen in wide-angle lenses.
Pincushion Distortion: The lateral magnification at the edges is greater than at the center, causing straight lines to bend inward. It is commonly seen in telephoto lenses.
Mustache Distortion: A complex high-order distortion where the center of the image exhibits barrel distortion while the edges transition to pincushion distortion. It is often found in high-performance apochromatic lenses.
2. Test Methods
Depending on the underlying principles, common camera distortion measurement solutions can be broadly divided into three categories.

3. Chart Selection
Array Chart Method:
The array chart method is the mainstream approach for distortion measurement. Its core principle is to calculate the distortion by measuring the coordinate deviations of regular array feature points. Different chart designs have different focuses and are suited for different scenarios.
| Chart Type | Product Image | Core Advantages | Core Disadvantages | Application Scenarios |
|---|---|---|---|---|
| Checkerboard | 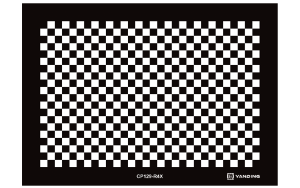 | High positioning accuracy, dense feature points, and stable distortion fitting | Prone to recognition failure under wide-angle / fisheye lenses | Camera intrinsic parameter calibration and ISP distortion correction coefficient fitting during the R&D phase |
| Dot Grid | 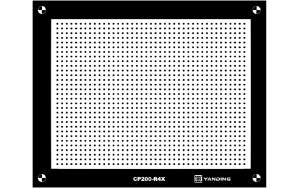 | Strong robustness and stable center positioning; insensitive to blur and noise, ensuring reliable recognition even at the edges of wide-angle / fisheye lenses. | Theoretical accuracy is slightly lower than that of the checkerboard | Automated production lines, quality inspection for automotive / mobile phone cameras |
| SFRplus Chart | 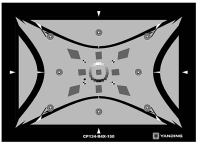 | Strong wide-angle adaptability: Through pre-distortion design, it supports imaging system testing with a field of view up to 150°, solving the problem of severe feature deformation and recognition failure of traditional charts under wide-angle / fisheye lenses. | Sparse sampling points, making it difficult to fit high-order distortion | Ultra-wide-angle distortion verification, image quality and corner resolution testing for panoramic cameras |
4. Specific Procedures (Taking the Array Chart Method as an Example)
4.1 Pre-test Preparation and Image Capture
1. Attach the dot grid/checkerboard test chart to a neutral gray backboard, centering it horizontally and keeping it level;
2. Adjust the light source color temperature and brightness to the target values (recommended: 6500K, 1000 Lux), and ensure the uniformity of the test chart surface reaches over 90%;
3. Secure the device in the fixture. Check the device lens for any dirt; if dirty, wipe it with a clean lens cloth. If the lens is damaged, replace the device;
4. Level the tripod and gimbal, and adjust the framing to ensure that, with the image filling the frame, the lens surface and the chart surface are relatively parallel, and the image is symmetrical vertically and horizontally;
5. Use a laser rangefinder to accurately measure and record the distance from the lens to the chart surface, facilitating subsequent data review and result verification, and preventing calculation errors caused by distance deviations.
6. Capture the test images after the scene has stabilized.
4.2 Software Analysis
1. Open the RIQA image quality testing software, click on the distortion test item, and select the corresponding test item based on the chart used for capture.

2. After importing the image into the RIQA image quality testing software, click “Start” to let the software automatically analyze the distortion. The results are shown in the figure below. The results include multiple test items, such as SMIA TV distortion value and lateral chromatic aberration (LCA).

4.3 Result Interpretation
 Distortion SMIA(%) is the measured SMIA TV distortion value; Max LCA(%) is the maximum lateral chromatic aberration as a percentage of pixel value, calculated according to the ISO 19084 standard; Optical Distortion(%) is the optical distortion percentage, calculated according to ISO 17850.
Data Charts:
(1) Optical and SMIA TV Distortion Curves
 The green curve is the data fitting curve for SMIA distortion, the blue curve is the fitting curve for optical distortion, and the red crosses are the true values for optical distortion. The two vertical lines represent the corresponding values for optical distortion in the vertical and horizontal directions, respectively. The horizontal axis represents the pixel distance from the image center. If the maximum distortion percentage is positive, it indicates pincushion distortion; if negative, it indicates barrel distortion.
(2) Grid Distortion Visualization
 Compares the captured image with an ideal distortion-free grid to visualize optical distortion. Overlaid on the image is a distortion-free Cartesian grid. Thin green lines connect the centers of the distorted points to the centers of their corresponding undistorted points.
(3) Lateral Chromatic Aberration
 The green, red, and blue lines in the chart represent the lateral chromatic aberration values for RB, RG, and BG, respectively. The measured lateral chromatic aberration results of the camera can be viewed directly.
See More
iso_17850_畸变测试、畸变_distortion