
 This page is not fully translated, yet. Please help completing the translation.
(remove this paragraph once the translation is finished)
Chromatic Aberration
1. What is Chromatic Aberration
Chromatic aberration, also known as “color fringing” or “purple fringing”, is a common optical issue that occurs when a lens fails to focus all wavelengths of color to the same focal plane, or when wavelengths of color are focused at different positions in the focal plane. It is a common lens aberration phenomenon, often manifesting as colored or purple fringes in the darkest or brightest boundary areas of an image. How is it produced?
2. Causes of Chromatic Aberration
2.1 Dispersion and Refraction of Light
An ideal lens would focus all wavelengths to a single focal point, which is the optimal focus for the “circle of confusion”, as shown in the figure below:

Unfortunately, such lenses do not exist in reality. Therefore, light of different colors travels at different speeds when passing through a lens. As a result, the image may appear blurred, or noticeable color fringes (red, green, blue, yellow, purple, magenta) may appear around objects, especially in high-contrast situations. In the example below, it can be seen that blue light is refracted more strongly than red light.

The intensity of refraction mainly depends on the optical density of the material the light passes through and the wavelength of the light. Short-wavelength light (blue) is refracted more strongly than long-wavelength light (red). Similarly, materials with high optical density refract light more strongly than those with low optical density. The optical density here refers to the refractive index.
Here are the refractive indices of some samples:

2.2 Two Types of Chromatic Aberration
In reality, the refractive index for each wavelength differs within a lens, which leads to two types of chromatic aberration: longitudinal chromatic aberration and lateral chromatic aberration.
a). Longitudinal Chromatic Aberration
When light passes through a lens, due to the dispersion characteristics of the glass, light of different colors focuses at different points along the horizontal optical axis; this is longitudinal chromatic aberration. In the illustration below, only the green light is focused on the imaging plane. The red and blue light form blurred circles on the sensor surface.

Lenses with longitudinal chromatic aberration can show fringes around objects throughout the entire image, even in the center. Red, green, blue, or a combination of these colors can appear around objects. Longitudinal chromatic aberration can be significantly reduced by stopping down the lens. Fast aperture lenses are generally more prone to longitudinal chromatic aberration than slow lenses. Below is an example of longitudinal chromatic aberration visible at different distances:

It can be seen that the green at the top of the image transitions to a neutral color in the middle, and then turns purple at the bottom of the image closer to the camera. This kind of longitudinal chromatic aberration exists even on high-end, expensive lenses. It can be significantly reduced in post-processing.
b). Lateral Chromatic Aberration
Lateral chromatic aberration occurs because light of different wavelengths is imaged on the same focal plane but not at the same point, as shown in the figure below.

Unlike longitudinal chromatic aberration, lateral chromatic aberration never appears in the center and only occurs in the corners of the image in high-contrast areas. Blue and purple fringing is common on some fisheye, wide-angle, and low-quality lenses. Moreover, lateral chromatic aberration cannot be eliminated by stopping down the lens, but it can be removed or reduced in post-processing software. As shown in the figure below, there is quite severe lateral chromatic aberration in the corners:

3. How to Eliminate Chromatic Aberration Through Lens Design
a). Achromatic Lenses
Achromatic correction is applied at both ends of the visible spectrum (red and blue). It is generally achieved by combining a convex crown glass element and a concave flint glass element, which is known as an achromatic doublet.
b). Apochromatic Lenses
Apochromatic correction brings three wavelengths (typically red, green, and blue) to the same focal plane. This is usually achieved by combining three lens elements. It is more complex and expensive compared to achromatic lenses.
c). ED Glass
The abbreviation ED stands for Extra-low Dispersion glass. Typically, the elements contained in achromatic and apochromatic lenses are made of low-dispersion glass.
d). Primary and Secondary Spectrum Chromatic Aberration
A completely uncorrected lens is called a chromatic lens, exhibiting primary spectrum chromatic aberration, where the red and blue focal points at the edges of the spectrum are different. However, most lenses feature an achromatic design, which brings the red and blue at the edges of the spectrum to the same focal point.
4. Lateral Chromatic Aberration Testing
For lateral chromatic aberration (CA) testing, it is necessary to select an appropriate image test chart to evaluate the CA value of an imaging system. In a standard image quality laboratory, professional test charts are photographed, and software analysis is used to obtain data results to check the lateral CA value. The optimal test positions for lateral chromatic aberration are the left and right edges of the test chart. Since lateral chromatic aberration is mostly seen in fisheye and wide-angle lenses, Yanding recommends using a dot chart for testing and analysis, which can test not only lateral chromatic aberration (CA) but also distortion.
4.1 Equipment Selection
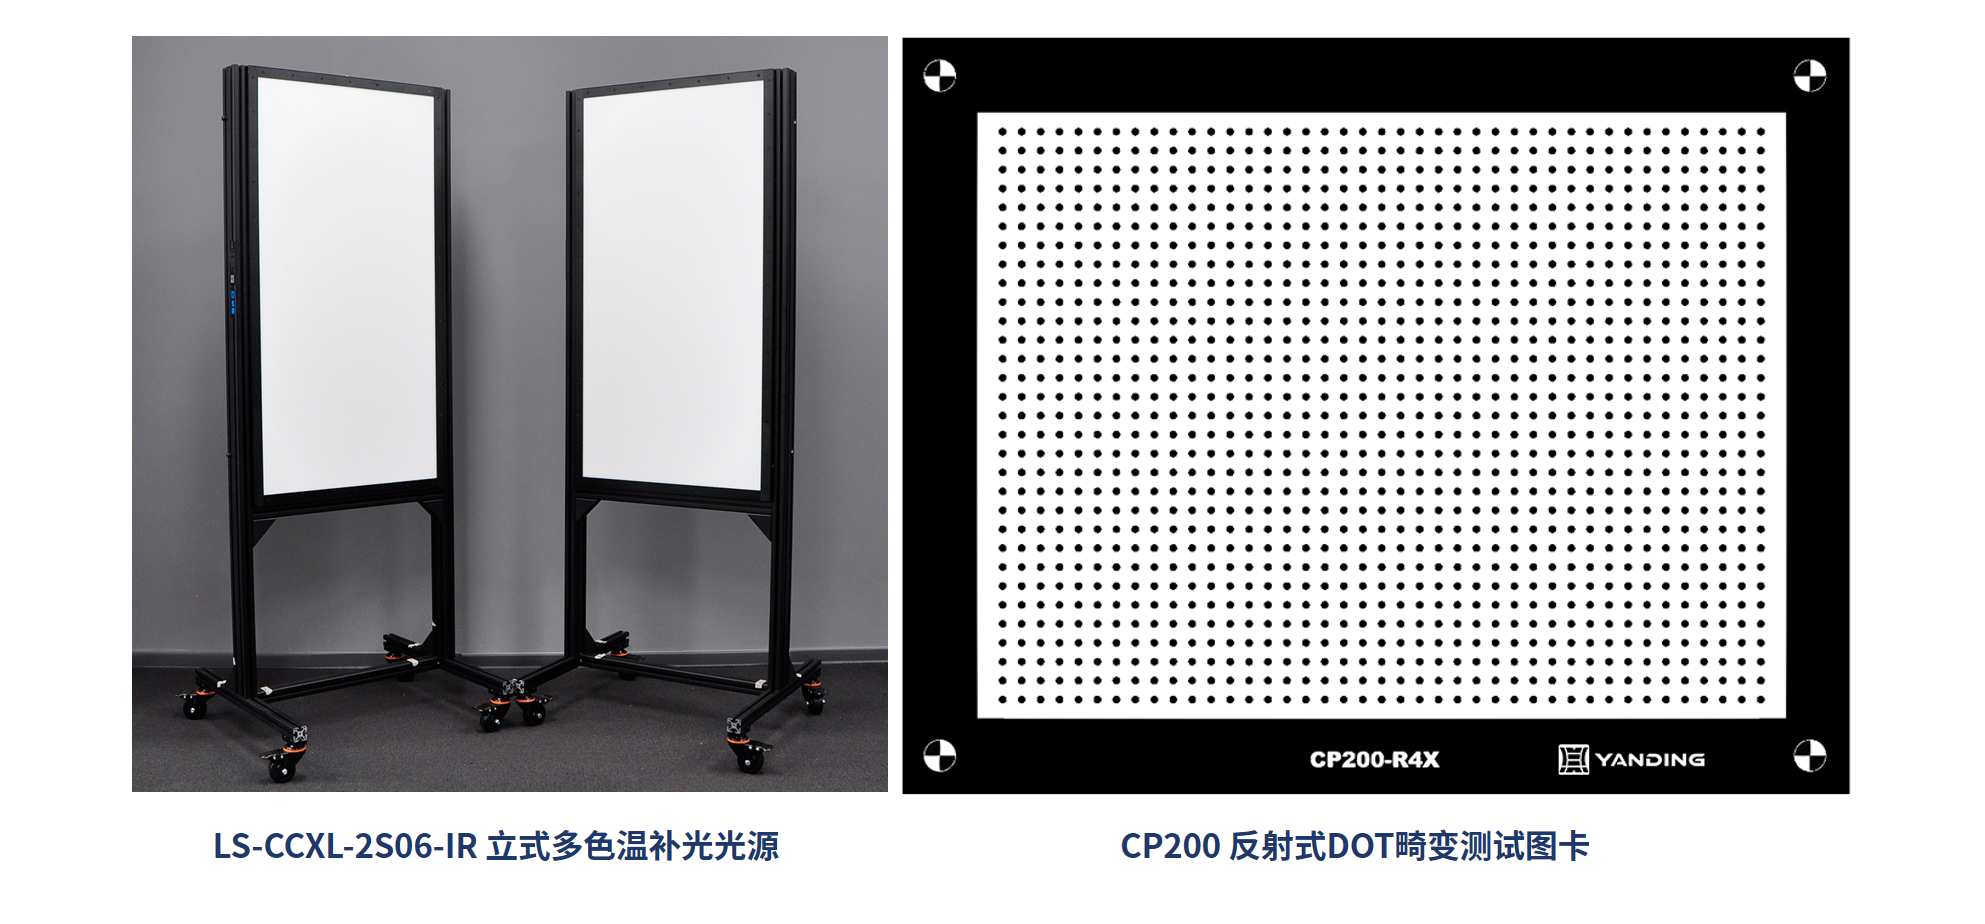
4.2 Test Procedures
1. Attach the dot chart to the neutral gray backboard, centered left and right, and aligned horizontally;
2. Adjust the light source color temperature and illuminance level to the target values (recommended 6500K, 1000 Lux), and ensure the uniformity of the test chart surface reaches over 90%;
3. Secure the device in the fixture. Check the device lens for dirt; if dirty, wipe it with a lens cloth. If the lens is damaged, replace the device;
4. Level the tripod and pan-tilt head, and adjust the frame to ensure that, with no less than 20×15 dots in the image, the lens surface and the chart surface are relatively parallel, and the frame is symmetrical vertically and horizontally;
5. When shooting, wait for the frame to stabilize before capturing. It is recommended to capture 3 sample images.
4.3 Software Analysis
1. Open the RIQA image quality testing software, click on the distortion test item, and select the dot chart test or checkerboard test according to the captured image.

2. After importing the image into the RIQA image quality testing software, click “Start”, and the software will automatically analyze the chromatic aberration and distortion. The results are shown in the figure below.

The test results include multiple test items, such as LCA test results and distortion test results, LCA curves, effect diagrams, etc., making the results clear at a glance.
See More
camera测试用例、测试用例、车载感知与显示技术方案