
 This page is not fully translated, yet. Please help completing the translation.
(remove this paragraph once the translation is finished)
Contrast Performance Indicators (CPI)
1. Concept of Contrast Performance Indicators (CPI)
Contrast is a crucial fundamental condition for distinguishing objects from their surroundings. Contrast Performance Indicators (CPI) are used to evaluate the contrast reproduction capability of an imaging system and are mainly divided into two types: Contrast Detection Probability (CDP) and Contrast Signal-to-Noise Ratio (CSNR).
Among them, Contrast Detection Probability (CDP, equivalent to the term CTA) is the pass percentage obtained through statistical analysis of the pixel contrast converted by the camera's OECF (Opto-Electronic Conversion Function) against the actual contrast.
Contrast Signal-to-Noise Ratio (CSNR) is calculated by first determining the noise value for each gray level and then further deriving the contrast-to-noise ratio.
Although evaluating the contrast reproduction capability of an imaging system in isolation cannot directly predict object recognition ability, it provides an effective diagnostic tool to help identify areas where contrast maintenance is inaccurate or performs poorly within the expected operating range. This is particularly important when using High Dynamic Range (HDR) sensors, where the noise distribution may not be monotonic, and an increase in signal level does not necessarily guarantee an improvement in signal-to-noise ratio.
2. How to Test Contrast Performance Indicators
2.1 Test Standard:
Based on the IEEE 2020-2024 standard.
2.2 Test Equipment:
The test equipment used for this test is the MLB-HMC ADAS Camera Comprehensive Tester independently developed by Yanding. By using the four transmissive light boxes at the rear, combined with four grayscale charts of different densities, and setting relevant parameters for the light source, different luminance patch distributions under high dynamic range are obtained to measure the CDP and CSNR indicators of the imaging system.
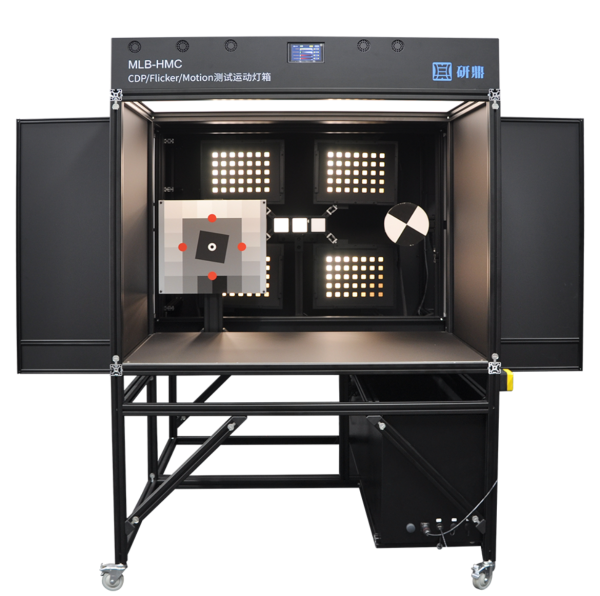
| MLB-HMC ADAS Camera Comprehensive Tester |
|---|
2.3 Test Procedure:
1. Environment Setup:
In a dark environment, insert four 35-step charts into the slots of the transmissive light boxes (the first chart is 20dB, the second is 35dB, the third is 35dB, and the fourth is 45dB, totaling 135dB). Turn on the four light sources with the default settings. This default setting uses calibrated light source brightness, where the luminance of the darkest patch on the first chart is slightly greater than that of the brightest patch on the second chart, the luminance of the darkest patch on the second chart is slightly greater than that of the brightest patch on the third chart, and so on for calibration.
2. Sample Capture:
Fix the DUT on the fixture and adjust the shooting distance so that the four light boxes fill the entire frame as much as possible. Once the image is stable, capture a RAW image with all light sources fully illuminated.
3. RIQA Operation:
Step 1. Open RIQA, select the CPI module in the ADAS module, add the RAW image to be analyzed, add or check if the grayscale patch luminance file is correct, and set the analysis point SAMPLE to 40000.

Step 2. Click Start and set the RAW image format. When importing the RAW file, you need to set information such as the width, height, and bit depth of the RAW file.
 The RAW settings need to be configured according to the RAW file's own information regarding width, height, bit depth, and Bayer pattern. If the RAW file is compressed, it can be decompressed using the decompression tool. During decompression, you need to set the width, height, decompressed file, and the bit depth before and after decompression. After clicking Confirm, a RAW file with the same name but with “depresse” appended will be generated in the same path. Re-import it for parsing and analysis.
Step 3. After completing the RAW settings, select the Region of Interest (ROI), and click Analyze to generate the test report with one click.
4. Result Interpretation:
Data Chart Interpretation:
 |
| CDP 3D Data Chart |
|---|
The three axes represent luminance, contrast, and CDP, respectively, intuitively presenting the relationship among the three and clearly reflecting the camera's contrast performance capability in different scenarios. A higher CDP value indicates better detection performance of the module. Generally, CDP values tend to be lower at positions with low luminance and low contrast, and vice versa.
 |
| CSNR 2D Data Chart |
|---|
In the chart, a larger CSNR value indicates less impact from noise and better detection performance of the module.