Test Chart Selection Guide
Test charts are standardized, reproducible tools essential for image quality evaluation (e.g., cameras, displays, LiDAR). They convert subjective visual perception into objective, quantifiable metrics.
This guide reviews chart purposes, key parameters, selection criteria, materials, mounting methods, handling, and storage to support accurate matching of testing requirements and proper chart use.
1. Overview
Test charts are standardized media used to quantitatively evaluate image quality. They contain specific patterns, color patches, gray patches, and other reference elements. By analyzing images of the chart captured by a device under test (DUT), core metrics such as resolution, distortion, color accuracy, and noise can be quantified.
 In industrial applications, test charts are critical for both product quality control and the optimization of imaging system performance during R&D. Various industry standards require the use of specific charts—for example, QC/T 1128 (automotive), GA/T 1127 (security), YY 0068.1 (medical), and Q/CR 967-2023 (railway)—to ensure compliance with regulatory requirements.
2. Core Purposes and Classification
2.1 Classification by Test Objective
| Test Objective | Corresponding Chart Type | Purpose | Typical Examples |
|---|---|---|---|
| Resolution |   | Evaluates the detail reproduction capability of the imaging system. Common metrics: MTF50, MTF50P, MTF30, MTF10, Aliasing Onset, etc. | ISO 12233 Resolution Chart 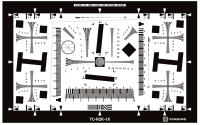 Used for DUT resolution testing, visual resolution in different directions can be analyzed through wedge patterns. The corresponding size and line pairs of the chart must be selected based on the DUT's resolution, field of view, and shooting distance. Used for DUT resolution testing, visual resolution in different directions can be analyzed through wedge patterns. The corresponding size and line pairs of the chart must be selected based on the DUT's resolution, field of view, and shooting distance.SFR Slanted Edge Chart 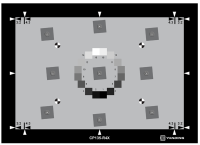 Complies with the ISO12233:2017 standard, containing 9 low-contrast slanted edge structures at a 5-degree angle, used for DUT resolution testing. Complies with the ISO12233:2017 standard, containing 9 low-contrast slanted edge structures at a 5-degree angle, used for DUT resolution testing. |
| Color |  | Evaluates color accuracy and white balance. Common metrics: Saturation, color difference, hue angle, etc. | Standard 24-Color Chart 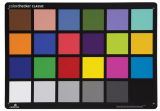 24 scientifically formulated color patches, providing true and natural color reproduction. 24 scientifically formulated color patches, providing true and natural color reproduction. |
| Uniformity |   | Evaluates luminance and color uniformity, dead pixels, etc. Common metrics:Center-to-corner luminance ratio, R/G/B channel ratios, etc. | 18% Neutral Gray Chart A neutral gray chart with 18% reflectance, providing a reliable neutral gray reference to ensure accurate white balance settings in various lighting environments. A neutral gray chart with 18% reflectance, providing a reliable neutral gray reference to ensure accurate white balance settings in various lighting environments.70% Light Gray Test Chart  The chart surface has a reflectance of 70%, suitable for CMS luminance uniformity (i.e., lateral uniformity) testing. The chart surface has a reflectance of 70%, suitable for CMS luminance uniformity (i.e., lateral uniformity) testing. |
| OECF / Dynamic Range |   | Evaluates grayscale reproduction, dynamic range (DR), and signal-to-noise ratio (SNR). Common metrics: Gray-scale response, dynamic range (DR), signal-to-noise ratio (SNR), etc. | Transmissive 36-Step High Dynamic Range Chart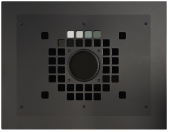 Grayscale distribution meets ISO14524 and ISO15739 standards, with a polarizer added in the center (adjustable light intake), contrast up to 30,000,000:1 (approx. 150dB), supporting extremely high dynamic range testing. Grayscale distribution meets ISO14524 and ISO15739 standards, with a polarizer added in the center (adjustable light intake), contrast up to 30,000,000:1 (approx. 150dB), supporting extremely high dynamic range testing. |
| Distortion |  | Evaluate the lateral chromatic aberration, SMIA TV distortion, and FOV . Common metrics: Distortion SMIA (%), LCA (lateral chromatic aberration), etc. | Reflective Checkerboard Chart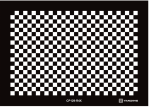 Regular square grid arrangement, enabling intuitive measurement of geometric distortions such as barrel distortion and pincushion distortion. Regular square grid arrangement, enabling intuitive measurement of geometric distortions such as barrel distortion and pincushion distortion. |
| Glare |  | Evaluate the glare condition of the imaging system; Common metrics: Flare index F, glare ratio, average glare attenuation, worst glare attenuation, etc. | Transmissive Flare Test Chart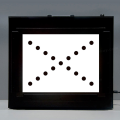 Complies with the ISO 18844 standard, featuring 17 black test spots distributed on a white background (arranged along double diagonals), specifically for quantifying lens stray light performance. Complies with the ISO 18844 standard, featuring 17 black test spots distributed on a white background (arranged along double diagonals), specifically for quantifying lens stray light performance. |
| Others |  |  |  |
2.2 Classification by Media Type
Reflective Charts
Principle: Rely on external lighting. The chart surface reflects incident light toward the camera sensor.

Transmissive Charts
Principle: Use a built-in backlight positioned behind the chart. Light passes through the chart and is captured by the imaging system.

3. Key Parameters
3.1 Aspect Ratio
Must match the DUT output ratio (e.g., 4:3 for industrial cameras, 3:2 for DSLRs, 16:9 for automotive/consumer devices).
→ Selection Principle: Chart aspect ratio must equal the DUT imaging ratio to avoid black borders, stretching, or cropping.
3.2 Magnification and Chart Size
Magnification (denoted as X, e.g., 0.5X, 1X, 2X, 4X, 8X) is the scaling factor of a reflective chart's effective image size relative to the manufacturer's baseline. It characterizes the chart's field-of-view coverage capability.
→ Selection Principle: Choose magnification based on test distance and DUT FOV. The effective chart area should occupy 60%–90% of the image height to provide sufficient detail for analysis software.
- Low magnification (0.1X, 0.2X): Small charts for short distances and narrow FOV (e.g., macro testing);
- Medium magnification (0.5X, 1X): Standard size, suitable for medium test distances and regular FOV (e.g., consumer electronics cameras);
- High magnification (2X, 5X, 8X): Large charts for long distances and large FOV (e.g., automotive surround-view cameras).
 Given the test distance (S) and field of view (FOV), chart dimensions are calculated as follows:
Based on the tangent function relationship: $\tan\frac{DFOV}{2}=\frac{D/2}{S}$, we can derive: $D=2S\tan\frac{DFOV}{2}$
Similarly, width and height are derived from HFOV and VFOV.
When the test distance is too long to accommodate the required chart size, a teleconverter may be used to achieve the field of view equivalent to that of a shorter shooting distance. Calculate the equivalent field-of-view angle based on the teleconverter’s magnification, then convert it into the corresponding chart size.
3.3 Measurement Accuracy
The “K” rating (2K/4K/8K) on ISO 12233 charts indicates the maximum theoretical resolution the chart can measure.
→ Selection Principle: Chart resolution ≥ DUT theoretical limit to capture true performance headroom.

3.4 Reflectance, Transmittance, and Contrast
Reflectance (R): The ratio of reflected luminous flux to incident luminous flux for reflective charts (%).
Transmittance (T): The ratio of transmitted luminous flux to incident luminous flux for transmissive charts (%).
Contrast Ratio: The ratio of luminance between the brightest and darkest areas on the chart.
Reflective Contrast = Brightest Area Reflectance (R_max) / Darkest Area Reflectance (R_min)
Transmissive Contrast = Brightest Area Transmittance (T_max) / Darkest Area Transmittance (T_min)
→ Selection Principle: Select the corresponding contrast based on testing requirements. For example: resolution testing recommends a low contrast of 4:1 according to the latest ISO 12233 standard; dynamic range testing requires high contrast test charts (e.g., the 36-step transmissive chart has a contrast of approximately 30,000,000:1).
3.5 Optical Density (OD)
When testing items such as dynamic range, signal-to-noise ratio, and grayscale levels, a density file often needs to be loaded during image quality analysis. The values in the density file are the standardized optical density values of different grayscale patches. The essence of this value is the logarithmic value of the “degree of light transmission/reflection attenuation,” and the attenuation of the chart's grayscale patches is mainly determined by the material's ability to absorb light.
 The calculation formula for OD is as follows:
$OD = \log_{10}\left( \frac{I_{0}}{I} \right)$
Where $I_{0}$ is the intensity of incident light; I is the intensity of transmitted or reflected light. A higher density value indicates that the material absorbs more light (i.e., reflects/transmits less light); a lower density value indicates that the material absorbs less light (i.e., reflects/transmits more light).
3.6 Print Accuracy
Print accuracy represents the ultimate “physical fineness” achievable by a chart’s pattern. The print accuracy of a chart varies depending on the manufacturing process and material. Insufficient print accuracy will lead to inaccurate line widths, spacing, and shapes of the chart pattern, causing distortion in test data and triggering mass production risks or R&D misjudgments (e.g., if print accuracy is poor, the precise black-and-white line edges required for MTF testing will become blurred or bleed, leading to falsely high/low MTF values; the grayscale patch edges required for dynamic range testing will bleed with coarse density transitions, resulting in large deviations or worthless test data). Conversely, excessively high accuracy requirements will significantly increase costs and deviate from actual needs.
Core metrics:
- Minimum Line Width (μm): The most core metric, referring to the thinnest black-and-white line width that can be stably printed on the chart (e.g., 20μm, 5μm), directly determining the highest test accuracy the chart can accommodate;
- DPI (Dots Per Inch): The basic parameter of the printing equipment, representing the number of printable pixels per inch. It is a reference for calculating the theoretical minimum line width, not the actual accuracy.
Theoretically, DPI and minimum line width can be derived through unit conversion, with the core formula being: $\text{Actual Minimum Physical Line Width (μm)} = \frac{25400}{\text{DPI}}$
This formula is only a “theoretical value,” and the actual minimum line width needs to be corrected based on the material.
→ Selection Principle: Clarify the accuracy requirements of the test objectives (allowable error, minimum line width, etc.), and then match the corresponding DPI, process, and carrier material.
Comprehensive Selection Guide: (1) Clarify DUT application requirements, (2) Match chart type and aspect ratio, (3) Calculate chart magnification to select the corresponding chart size, (4) Adapt material and contrast according to the test environment and DUT application. Avoid blindly choosing “large size/high parameters”—the right chart ensures test accuracy while controlling costs.
4. Chart Materials and Mounting Methods
4.1 Chart Materials
Print accuracy is the “printing stage upper limit” of chart accuracy, but the material determines whether this upper limit can be realized. The selection of chart material generally directly locks in the material's accuracy upper limit.
Common chart materials are as follows:
 Material selection depends on requirements: Ceramic and soda-lime glass are the ultimate choices for ultra-high precision and long-term stable calibration; white PE and PET films are practical solutions balancing cost and performance; photographic film and matte paper are suitable for limited budgets with lower requirements for accuracy and durability.
4.2 Mounting Methods
Mounting, simply put, is “fixing + protecting” the chart. It usually involves fixing or laminating the chart onto a certain material or structure to keep the chart flat, durable, and accurate for testing.

5. Usage and Storage of Test Charts
Proper storage and handling can extend a chart’s service life and help maintain measurement accuracy.
5.1 Proper Storage and Handling
(1)Temperature, humidity, and environment:
Store the chart at approximately 20 °C and 40%–60% relative humidity.
Keep it away from high temperatures and moisture to prevent oxidation of the coating or mold growth on the substrate.
Keep the area where the chart is used clean and protect the chart from direct sunlight. Use the chart in a laboratory with standardized lighting conditions.
(2) Storage method:
Wrap each rigid chart (e.g., PVC or glass) individually in anti-static protective film.
Do not stack or compress charts, as this may cause scratches or deformation.
Roll flexible film charts without creasing and store them in dedicated cylindrical tubes; do not fold them.
Keep glass charts away from hard objects to prevent breakage.
(3) Handling precautions:
Wash and dry your hands before handling the chart.
Do not touch it with sweaty or damp hands.
Wearing gloves and a mask is recommended.
Do not use liquids to clean the chart; use compressed air to remove dust from its surface.
5.2 Chart Maintenance and Scrapping Standards
Chart Maintenance:
High temperatures, moisture, ultraviolet radiation, and dust may cause mold growth, edge lifting, adhesive failure, or fading. Improper cleaning may wear away the coating, while fingerprints and scratches may affect measurement accuracy. Inspect the chart regularly to assess its condition and wear. Color-measuring instruments and densitometers can be used to check the chart. Quantitative measurements, such as color difference and spectral reflectance, can help determine whether maintenance or replacement is required.
Replacement criteria:
As a general guideline, replace black-and-white charts every two years and color charts every year. Replace a chart immediately if the patterned area is damaged, scratched, soiled, incomplete, or creased.