 This page is not fully translated, yet. Please help completing the translation.
(remove this paragraph once the translation is finished)
RIQA-Camera Resolution Module
Resolution is used to evaluate the ability of an imaging system (such as cameras, lenses, etc.) to reproduce details at different spatial frequencies. This module supports the analysis of various mainstream test targets, including slanted-edge targets, line pair targets, Siemens star targets, and dead leaves targets, meeting the resolution evaluation needs in different scenarios.
Test Charts Supported by the Resolution Module
(Click on a chart to view its detailed information)
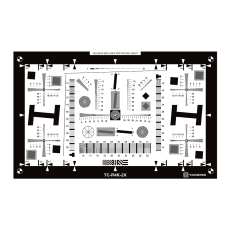
| Edge-SFR | E-SFR(ISO 12233) | E-SFR(ISO 12233:2023) |
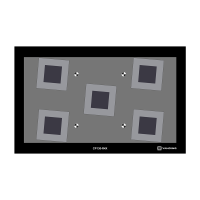 | 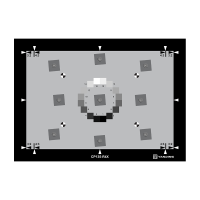 | 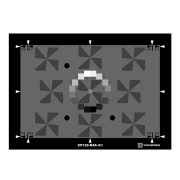 |
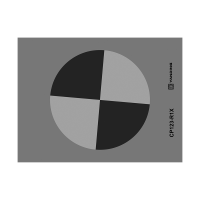
| 5°checkerboard | Wedge | SFRreg Test Chart |
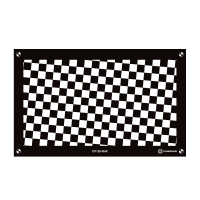 |  |  |
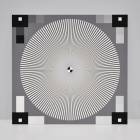
| Texture | Sine-SFR | Purple Fringing |
 |  |  |
Edge-SFR Analysis Module
Procedure
(1) Open the software and select “Edge-SFR” in the “Resolution” module.

(2) Click “Add” to import the images to be analyzed.

 To modify the unit or maximum value of the horizontal axis (spatial frequency), click “Settings”, select “Global Settings”, and modify it in the “Resolution Module”.
 |
| Horizontal Axis Unit Modification |
Unit Descriptions:
LP/PH (Line Pairs per Picture Height): Represents the number of black and white line pairs within the picture height.
LW/PH (Line Widths per Picture Height): Represents the total number of lines of equal width placed side by side within the height of the test target or the vertical field of view of the camera.
Cycles/Pixel: Represents the number of cycles (i.e., line pairs) that can be resolved per pixel in the imaging device.
Cycles/MM: Represents the number of cycles (i.e., line pairs) that can be resolved per millimeter in the imaging device.
 |
| Horizontal Axis Maximum Value Modification |
(3) Select the image and click “Start” to proceed to the next step.

(4) Draw a box to select the ROI (Region of Interest) to be analyzed, and click “Analyze” to proceed to the next step.

(5) View the analysis results.

(6) Click “Generate Report”, enter the file name, select the save directory and file format, and click “Export”. The saved report can then be viewed in the specified path.

Result Interpretation
The output report includes: MTF curve, LSF grayscale image, slanted-edge block grayscale image, and measurement results for each ROI (including MTF50, MTF50P, MTF30, MTF10, etc.).

| Metric | Definition |
| MTF50 | The spatial frequency at which the MTF drops to 50% contrast |
| MTF50P | The spatial frequency at which the MTF drops to 50% of its peak value |
| MTF30 | The spatial frequency at which the MTF drops to 30% contrast |
| MTF10 | The spatial frequency at which the MTF drops to 10% contrast |
| Sharpening | The sharpening value of the image; sharpening compensates for image contours, enhances edges and grayscale transitions, and makes the image clearer |
| Over Shoot(%) | The ratio of the luminance exceeding the average white level due to exposure in the slanted-edge block |
| Under Shoot(%) | The ratio of the luminance falling below the average black level due to exposure in the slanted-edge block |
| Roughness(pxls) | The roughness of the slanted edge |
| MTF@83C/mm | The MTF value at 83 cycles per millimeter |
| MTF@0.125C/p | The MTF value at 0.125 cycles per pixel |
| MTF@0.25C/p | The MTF value at 0.25 cycles per pixel |
| CA(pixels) | Lateral chromatic aberration |
Among them, the modulation transfer function (MTF) is a key metric for quantifying the ability of an imaging system to transfer image details. The MTF curve describes the relationship between contrast and spatial frequency on the image plane. The horizontal axis represents spatial frequency, with units of LP/PH (or LW/PH, Cycles/Pixel, Cycles/MM; refer to step (2) for how to change the units), and the vertical axis represents the MTF, which generally ranges from 0 to 1. If the image has been sharpened, the MTF value may exceed 1.
