 This page is not fully translated, yet. Please help completing the translation.
(remove this paragraph once the translation is finished)
RIQA-Camera Grayscale Analysis Module
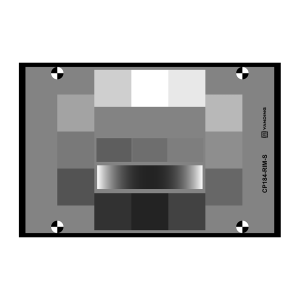
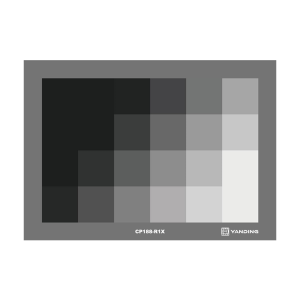
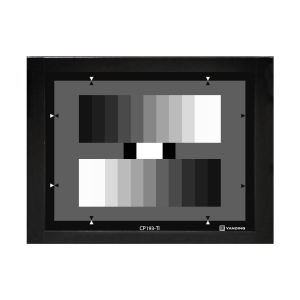
Grayscale refers to the continuous luminance levels in an image ranging from the darkest (black) to the brightest (white). This module supports the analysis of multi-specification grayscale test charts (both transmissive and reflective), such as 12-patch, 20-patch, and 36-patch charts. It also allows you to invoke the Single SNR function within the module for targeted analysis of specified regions, which is used to evaluate metrics such as dynamic range, grayscale response, signal-to-noise ratio, and white balance.
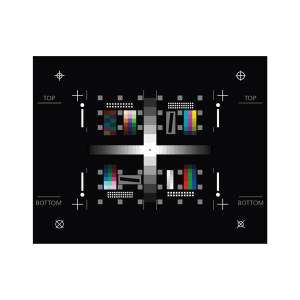
Test Charts Supported by the Grayscale Module
(Click on a chart to view its specific information)
| OECF 20-Patch | OECF 36-Patch | OECF Q14 | |
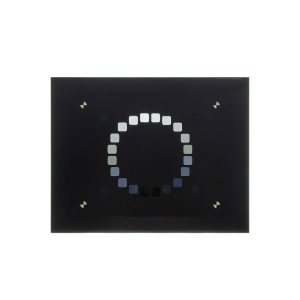 | 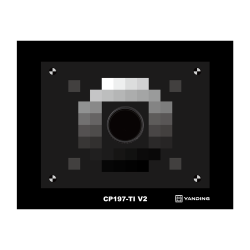 | 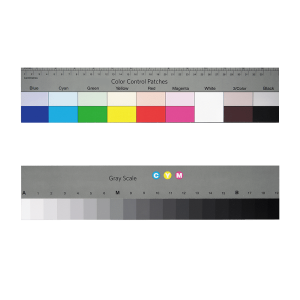 | |
| OECF 12-Patch | Noise Test Chart | OECF 24-Patch | |
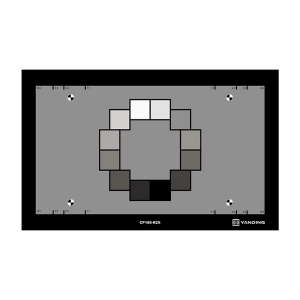 |  |  | |
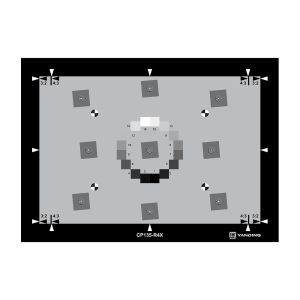
| GAT1127 | Single SNR | Luminance Test Chart | OECF 16-Patch |
 |  |  |  |
OECF 36-Patch Analysis Module
(The operation steps and result interpretation for the OECF Q14/OECF 12-Patch/Noise Test Chart/OECF 24-Patch/Luminance Test Chart/OECF 16-Patch modules can also refer to this section)
Operation Steps
(1) Open the software and select “OECF 36-Patch” (“OECF Q14”/“OECF 12-Patch”/“Noise Test Chart”/“OECF 24-Patch”/“Luminance Test Chart”/“OECF 16-Patch”) in the “Grayscale” module.
 (2) Click “Add” to import the image to be analyzed.

 (3) Select the image, choose the chart type and the corresponding grayscale reference file (density file), and click “Start” to proceed to the next step.


 (4) Frame the region to be analyzed and click “Next”.
 (5) Fine-tune the ROI and click “Analyze” to proceed to the next step.
 (6) View the analysis results.
 (7) Click “Generate Report”, enter the file name, select the save directory and file format, and click “Export” to view the saved report in this path.


Result Interpretation

| Metric | Definition |
| Average Noise (R) | R channel average noise |
| Average Noise (G) | G channel average noise |
| Average Noise (B) | B channel average noise |
| Average Noise (Y) | Y channel average noise |
| 1 (Low) | Dynamic range determined by the patch with SNR=1 and the saturated patch |
| 2 (Medium) | Dynamic range determined by the patch with SNR=2 and the saturated patch |
| 4 (Med-High) | Dynamic range determined by the patch with SNR=4 and the saturated patch |
| 10 (High) | Dynamic range determined by the patch with SNR=10 and the saturated patch |
| Average SNR | Average signal-to-noise ratio |
| Gamma | Measured Gamma value |
| Exposure Error | Exposure error |
| Number of Patches with △Y>8 | Number of consecutive patches with a mean difference greater than 8 |
| ISO Dynamic Range (den) | Dynamic range (OD) |
| ISO Dynamic Range (f-stop) | Dynamic range (f-stop) |
| ISO Dynamic Range (dB) | Dynamic range (dB) |
| snr_total | Signal-to-noise ratio |
| snr_total(dB) | Signal-to-noise ratio (dB) |
| σ_total | Noise |
OECF 20-Patch Analysis Module
Operation Steps
(1) Open the software and select “OECF 20-Patch” in the “Grayscale” module.
 (2) Click “Add” to import the image to be analyzed.

 (3) Select the image, choose the corresponding grayscale reference file (density file), and click “Start” to proceed to the next step.

Note: The default reference file for the OECF 20-Patch analysis module is 20Patch. To add other grayscale reference files, please refer to the following process:


(4) Fine-tune the ROI and click “Analyze” to proceed to the next step.

(5) View the analysis results.

Result Interpretation
Click to view
GAT1127 Analysis Module
Result Interpretation
 (1) Average Noise (R): R channel average noise.
(2) Average Noise (G): G channel average noise.
(3) Average Noise (B): B channel average noise.
(4) Average Noise (Y): Y channel average noise.
(5) 1 (Low): Dynamic range determined by the patch with SNR=1 and the saturated patch.
(6) 2 (Medium): Dynamic range determined by the patch with SNR=2 and the saturated patch.
(7) 4 (Med-High): Dynamic range determined by the patch with SNR=4 and the saturated patch.
(8) 10 (High): Dynamic range determined by the patch with SNR=10 and the saturated patch.
(9) Average SNR: Average signal-to-noise ratio.
(10) Gamma: Measured Gamma value.
(11) Exposure Error: Exposure error.
(12) Number of Patches with △Y>8: Number of consecutive patches with a mean difference greater than 8.
(13) ISO Dynamic Range (den): Dynamic range (OD).
(14) ISO Dynamic Range (f-stop): Dynamic range (dB).
(15) snr_total: Signal-to-noise ratio.
(16) snr_total(dB): Signal-to-noise ratio (dB).
(17) σ_total: Total noise.
Single SNR Module
Result Interpretation
 (1) SNR R: R channel signal-to-noise ratio.
(2) SNR G: G channel signal-to-noise ratio.
(3) SNR B: B channel signal-to-noise ratio.
(4) SNR Y: Y channel signal-to-noise ratio.
(5) SNR(db) R: R channel signal-to-noise ratio (dB).
(6) SNR(db) G: G channel signal-to-noise ratio (dB).
(7) SNR(db) B: B channel signal-to-noise ratio (dB).
(8) SNR(db) Y: Y channel signal-to-noise ratio (dB).
(1) SNR R: R channel signal-to-noise ratio.
(2) SNR G: G channel signal-to-noise ratio.
(3) SNR B: B channel signal-to-noise ratio.
(4) SNR Y: Y channel signal-to-noise ratio.
(5) SNR(db) R: R channel signal-to-noise ratio (dB).
(6) SNR(db) G: G channel signal-to-noise ratio (dB).
(7) SNR(db) B: B channel signal-to-noise ratio (dB).
(8) SNR(db) Y: Y channel signal-to-noise ratio (dB).