 This page is not fully translated, yet. Please help completing the translation.
(remove this paragraph once the translation is finished)
Yanding Road Traffic Signal Light Simulation and Testing Platform
With the continuous development of autonomous driving technology, corresponding testing methods must also be upgraded synchronously. Current testing mostly focuses on lane detection, object tracking, and scene understanding. However, road traffic signal light recognition, as a critical component in visual perception systems, remains insufficiently tested.
At Yanding, we are committed to changing this status quo. We have independently developed a traffic signal light simulation and testing platform, specifically designed to evaluate the perception capabilities of cameras under real signal conditions and failure modes.
This product adopts a 10×4-color LED array structure, integrating red, yellow, green, and white light-emitting units. The brightness of each individual LED bead can be independently adjusted, thereby simulating various types of traffic signal lights, from traditional low-brightness incandescent lamps to modern high-intensity directional LED signal lights.
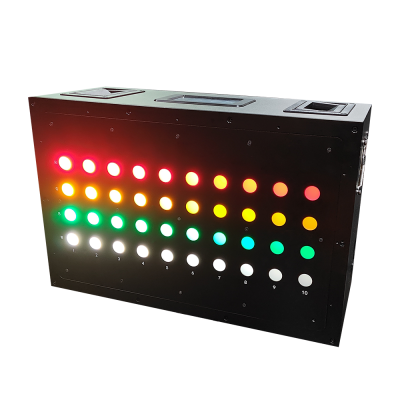 |
| Traffic light simulation array: 10 columns × 4 colors (red, yellow, green, white), supporting programmable control |
This high-precision control is particularly crucial. Although modern HDR image sensors claim to support a dynamic range of over 100 dB and use 16-bit or even 24-bit quantization, this data is ultimately compressed to 8 bits before being fed into neural networks. This tone mapping introduces compression artifacts and quantization noise, which can easily cause information loss, especially for small yet bright critical targets like traffic signal lights.
Saturation, Color Shift, Flicker, and Signal Failure Simulation
In real-world traffic environments, one of the most common issues is color channel saturation: the signal from a red or yellow light may overwhelm other colors, leading to color recognition errors in the image. This problem is more likely to be amplified after the image is processed by the ISP.
To further challenge perception systems, our testing platform also supports precise control of signal flicker parameters, including frequency and duty cycle. It can simulate everything from low-frequency flickering incandescent lamps common in the US to high-frequency PWM-dimmed LED signal lights prevalent in Asia and Europe. By simulating different flicker patterns, we can test the response capabilities of camera sensors and algorithms to temporally unstable signals, which is often the main cause of signal loss or misjudgment.
Our system can monitor the following performance metrics:
- Saturation sequence of each channel under different light intensities
- Hue and saturation changes of red and yellow signals at different brightness levels
- Hue/saturation difference thresholds, which automatically trigger warnings when exceeded, reporting that color signals are indistinguishable or fail to meet classification requirements.
- Frame drops or signal loss caused by flicker in cameras with multiple exposure or rolling shutter architectures
We treat signal loss caused by color channel saturation and flicker as functional failures and flag them accordingly. This not only helps developers evaluate their sensors and ISP systems but also significantly enhances their adaptability in real-world scenarios.
Image Analysis and Signal Verification Functions
The platform supports an image analysis workflow that combines automatic and manual processes to extract key visual metrics from captured images:
1. Automatic Detection
 |
| Automatic recognition of traffic light positions |
The system can automatically recognize light positions and align them with the geometric structure of the signal lights.
2. Manual Assisted Positioning
 |
| Manual assisted detection |
When automatic detection fails, users can manually annotate grid corners, and the system will interpolate to generate signal positions.
3. RGB Stack Plot
 |
| Calculating RGB signal values via pixel averaging |
4. Comparative Testing of Two Cameras
 |
| Comparison of shots from two HDR cameras under controllable brightness and flicker conditions in the same test scenario |
Visual Observation Results
Left image: Maintains color accuracy over a wider dynamic range, with most color patches retaining accurate hue and separation. Saturation only occurs in the bottom row, where white light clips as expected under extreme lighting conditions.
The right image presents a stark contrast to the left: color patches saturate prematurely, with weak color separation. Starting from the fifth column, red, yellow, and green begin to mix, resulting in color recognition failure; only the top 3–4 rows are properly exposed.
We also observed that the top red light shifts towards orange-yellow, and the bottom white light exhibits a green shift. This distortion may originate from local tone mapping or histogram equalization algorithms (such as CLAHE) in the ISP, which process different regions inconsistently, disrupting white balance and local contrast.
These results underscore the importance of controlled signal testing under known brightness and flicker conditions. The visual differences between different sensors highlight the decisive role of sensor characteristics and ISP tone mapping in reproducing safety-critical color information.
Quantitative Analysis: RGB Channel Response to Signal Intensity
In addition to the visual comparisons above, we also analyzed the RGB values of red and yellow signals from the two cameras at different brightness levels (columns 1 to 10). These values were calculated by averaging the pixel brightness in the central region of each color patch.
Left Camera – Better Performance
 |
| RGB values of red and yellow signals for the left camera from columns 1 to 10 |
For the red light signal, the RGB channels gradually increase and only begin to saturate at column 7 (corresponding to the white clipping at the very bottom of the photo), demonstrating good dynamic response.
Under the yellow light signal, the green channel saturates first, followed by blue, and then red. This staggered saturation phenomenon is an important finding, particularly evident when observing the cropped regions of red and yellow captured by this camera.
 |
| Top is the red signal, gradually turning yellow, then white |
It can be observed that the red signal temporarily takes on a yellow or orange hue before fully saturating. This color shift could mislead algorithms into recognizing red as yellow, leading to severe safety misjudgments.
Right Camera (Poor Performance)
 This set of data reveals an even more concerning phenomenon. For the red signal, all RGB channels are fully saturated before row 3, after which no color gradient or valid color recognition can be provided.
The yellow signal issue is even more severe: the green channel is saturated from the very first row, blue reaches its maximum at column 3, and red saturates around column 5.
This response indicates that the camera is fundamentally incapable of capturing true colors; the ISP's white balance and tone mapping modules cause color distortion or eliminate differences between colors. In fact, the color representation of all signals is incorrect—making this camera (even if it is an automotive-grade camera with auto-exposure) highly unsuitable for traffic signal light detection.
These charts, combined with our structured simulation platform and visualization tools, highlight the urgent need for rigorous certification of cameras in visual perception systems. Even sensors touted as “HDR-ready” can lead to catastrophic misinterpretations of safety-critical signals due to their ISP design, tone mapping, and exposure control strategies.