This page is not fully translated, yet. Please help completing the translation.
(remove this paragraph once the translation is finished)
Image Solutions for "QC/T 1128-2019: Automotive Cameras"
Overview
“QC/T 1128-2019: Automotive Cameras” is a recommended standard for China's automotive industry, issued and implemented in 2019. It applies to vehicle-mounted cameras used in scenarios such as driving assistance, surround view, and reversing, covering parameter requirements and test methods related to optical performance, imaging quality, and reliability. This article will focus on interpreting its image performance testing content.
Its image performance testing content covers the definitions and test methods for objective evaluation metrics such as sharpness, frame rate, signal-to-noise ratio (SNR), gray scale, dynamic range (DR), field of view, automatic gain control, white balance, color reproduction, glare, and ghosting.
Objective Evaluation of Image Quality
1. Frame Rate
Definition:
The number of complete images generated per unit time. That is, the total number of scans of the spatial lines of the video signal per unit time.
Metrics:

Method:
The DUT (Device Under Test) is tested in operating mode B1 (i.e., the test sample is normally electrically connected, all functions operate normally, and an external display device is required). The output video signal is tested using a video analysis device.
Solution:
Camera Temporal Frame Rate Tester
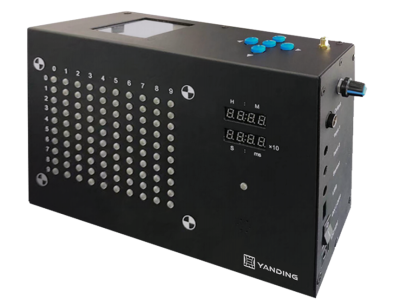 The Camera Temporal Frame Rate Tester is a high-precision testing device specifically designed to evaluate the temporal performance of cameras. It supports an adjustable frequency range of 0.1~2000 Hz and an adjustable duty cycle of 1%~100%. It can also cover various light sources and wavelength bands (such as green visible light, full-spectrum white light 450~950 nm, with optional independent control for red light, 850 nm infrared, and 940 nm infrared), making it suitable for the temporal performance testing and verification of various types of cameras.
2. Effective Pixels
Definition:
Pixels in an electronic image sensor that can perform effective photoelectric conversion and output image signals.
Metrics:

Method:
The DUT is tested in operating mode B1 (i.e., the test sample is normally electrically connected, all functions operate normally, and an external display device is required). The output video signal is tested using a video analysis device.
3. Field of View
Definition:
In a camera device, the angle formed by the two extreme edges of the maximum range through which the image of the target can pass through the lens, with the center of the camera lens as the vertex.
Metrics:
The recommended HFOV for the product is 30~200°; the recommended VFOV is 20~160°. The specific HFOV and VFOV can be negotiated and determined by the supplier and the buyer based on the different application scenarios of the product.
Method:
The light source color temperature is set to D65 (range: 6500K ± 325K); the illuminance is set to 800 Lux ± 80 Lux;
The DUT is tested in operating mode B1, and the test procedure is as follows:
a) Fix the DUT horizontally at the center of the indexing plate. The distance between the lens surface of the DUT and the test chart is 500 mm, and the center of the lens should align with the center of the indexing plate (the accuracy of the indexing plate must not be lower than 0.5°);
b) Rotate the indexing plate so that the vertical mark line of the test chart appears on the far left of the monitor display interface, and read the rotation angle value ∠a. Adjust the indexing plate in the reverse direction so that the vertical mark line of the test chart appears on the far right of the monitor display interface, and read the rotation angle value ∠b. The difference between ∠b and ∠a is the HFOV;
c) Rotate the DUT by 90° and fix it at the center of the turntable. The VFOV can be measured in the same way.

Solution:
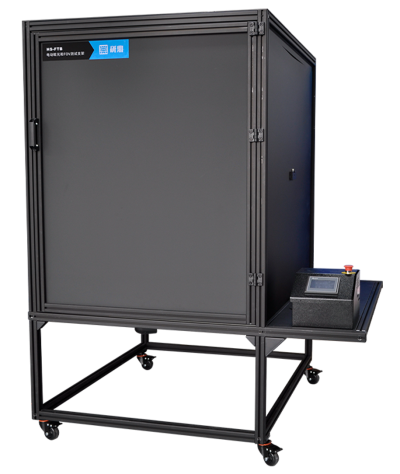
HS-FTB Glare Test Box
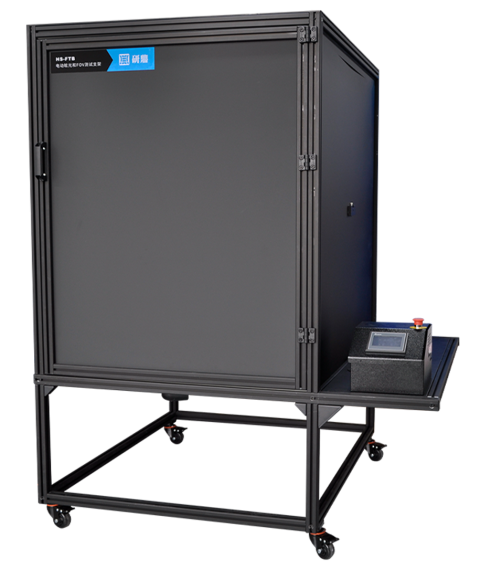 The HS-FTB Glare Test Box is a desktop five-axis test platform featuring high precision and a multi-scenario darkroom environment. The camera end supports five-axis manual movement and two-axis programmable automatic rotation, facilitating flexible adjustment of the camera position. The motorized turntable has an angular accuracy of within 0.1°, enabling camera FOV angle testing.
 Rotate the FTB glare test bracket to make the light source appear on the far left and far right of the image display interface to test the HFOV.
 Rotate the FTB glare test bracket to make the light source appear at the top and bottom of the image display interface to test the VFOV.
4. MTF Value Testing
Definition:
Resolution refers to the response function of the spatial frequency of a camera device, characterizing the device's ability to resolve the details of the captured scene.
Metrics:
The horizontal or vertical MTF values of the product shall comply with the specifications in the following table:

Method:

The test procedure is as follows:
HFOV ≥ 140°
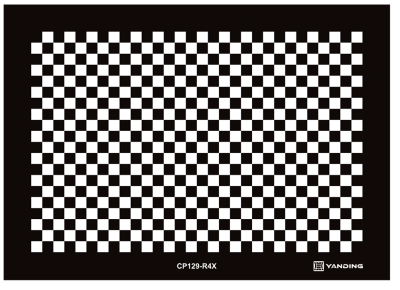
Refer to the layout shown to set up the test equipment and use a slanted-edge test chart or a checkerboard test chart compliant with ISO 12233 requirements. The DUT is tested in operating mode B1.
a) Adjust the distance between the DUT and the test chart so that the length of the square edges on the test chart is no less than 10 pixels;
b) Adjust the DUT so that the angle between the edge of the square in the center field of the test chart and its corresponding direction is approximately 5°;
c) Adjust the DUT so that its optical axis is orthogonal to the plane of the test chart, and use image processing software to analyze the MTF50P value of the center field;
d) The DUT can be rotated horizontally or vertically to place the tested square of the test chart at the 70% field position, ensuring that the length of the square edges on the test chart is no less than 10 pixels;
e) Use image processing software to analyze the MTF50P values at the 70% field (the four corners: top-left, top-right, bottom-left, and bottom-right).
HFOV < 140°
Refer to the layout shown above to set up the test equipment and use a slanted-edge test chart compliant with ISO 12233 requirements. The DUT is tested in operating mode B1.
The test procedure is as follows:
a) Adjust the DUT so that the angle between the edge of the square on the test chart in the field of view and its corresponding direction is approximately 5°;
b) Analyze the MTF50P values of the center field and the 70% field (the four corners: top-left, top-right, bottom-left, and bottom-right) using the image processing software in the video analysis device.
Solution:
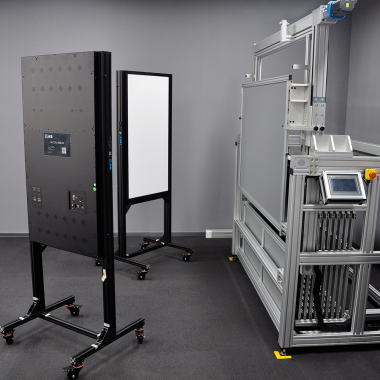
Recommended Light Sources:
Multi-CCT LED Fill Light Source
Recommended Test Charts:
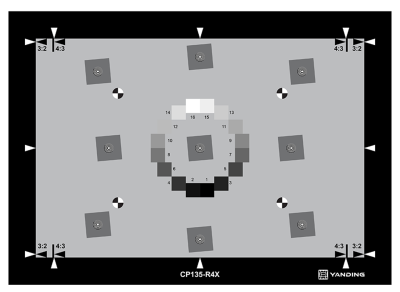
Slanted Edge Test Chart
Recommended Image Quality Analysis Software:
RIQA Image Quality Analysis Software
5. Signal-to-Noise Ratio (SNR)
Definition:
The ratio of the magnitude of the video signal to the magnitude of the noise signal (unwanted signal), expressed in dB.
$\text{SNR (dB)} = 20\log_{10}\left(\frac{\text{Si}}{\text{Ni}}\right)$
Where:
${Si}$: Signal of patch \( i \) (average pixel luminance value).
${Ni}$: Noise value of patch \( i \) (standard deviation of pixel luminance values).
Metrics:
The SNR of SD products shall be no less than 34.7 dB; the SNR of HD products shall be no less than 30 dB.
Test Method:
Select an OECF test chart compliant with GB/T 19894, and test the DUT in operating mode B1.
The test procedure is as follows:
a) Use a D50 area light source, adjust the light source luminance according to 5.4.3 in ISO 15739:2013, and the final output digital luminance value of the 18% gray patch area on the OECF chart should be 110~130 (recommended value is 118). The backlight luminance uniformity shall be no less than 90%, and the amplitude variation of luminance shall be no greater than 2%;
b) For DUTs with HFOV<140°, select an area of no less than 64×64 pixels at the center of each gray patch; for DUTs with HFOV>140°, select an area of no less than 45×45 pixels at the center of each gray patch;
c) Use image processing software to analyze according to Annex B of ISO 15739:2013, and obtain the overall average SNR of all patches.
Solutions:
Recommended Light Source:
Standard Transmissive Light Box
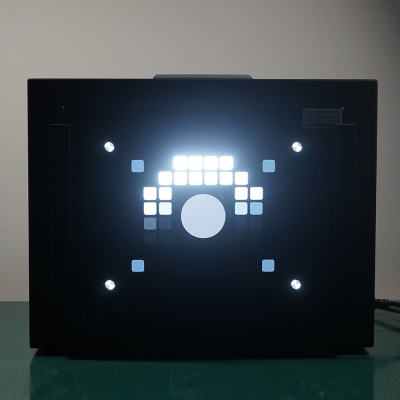 While ensuring excellent color rendering and uniformity, this light box also achieves an industry-leading high surface illuminance of 150,000 lux, and can be used for measuring the signal-to-noise ratio, dynamic range, luminance/color uniformity, and LED flicker performance of digital cameras.
Recommended Test Chart:
Transmissive 36-Step High Dynamic Range Test Chart
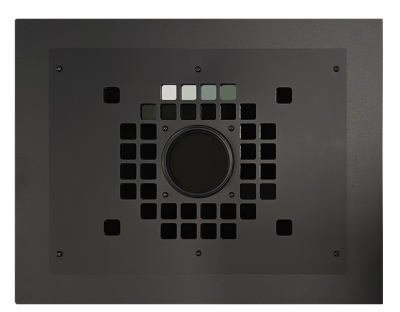 Unlike traditional charts, this chart specially adds a polarizer at the center position, providing a brand-new solution for devices that cannot manually adjust exposure. Its gray scale distribution meets the ISO 14524 and ISO 15739 standards, and the chart contrast is as high as 30,000,000:1 (approximately 150 dB), which can meet the testing requirements of extremely high dynamic range imaging systems.
6. Dynamic Range
Definition:
The maximum tonal range from the darkest black to the brightest white that a camera device can record. A larger dynamic range indicates more distinct levels in the captured image. All exposure values beyond the dynamic range can only be recorded as pure black or pure white. It essentially describes the ability of the camera device to record image gray levels, which can be expressed by the number of gray steps on a gray scale test chart.
Metrics:
The dynamic range of SD products shall be no less than 60 dB; the dynamic range of HD products shall be no less than 85 dB.
Method:
Select an OECF test chart compliant with GB/T 19894, and test the DUT in operating mode B1 according to the method specified in 6.3 of ISO 15739:2013.
The test procedure and calculation method are as follows:
a) Use a D50 area light source, adjust the light source luminance according to the requirements of 5.4.3 in ISO 15739:2013, and the final output digital luminance value of the 18% gray patch area on the OECF chart should be 110~130 (recommended value is 118). The backlight luminance uniformity shall be no less than 90%, and the amplitude variation of luminance shall be no greater than 2%;
b) Select an area of no less than 32×32 pixels at the center of each gray patch;
c) Calculate the dynamic range value according to the following formula.
$$\text{DR} = 20 \left( D_{\text{SNR}=1} - D_{\text{SNR}=\text{MAX}} \right)$$
Where: $D_{\text{SNR}=1}$ — the optical density value of the patch corresponding to an SNR close to 1; $D_{\text{SNR}=\text{MAX}}$ — the optical density value of the patch corresponding to an SNR close to the maximum value.
Solutions:
Recommended Light Source:
Standard Transmissive Light Box
This standard transmissive light box achieves a high surface illuminance of 150,000 lux (a relatively high level in the industry). Combined with its fine adjustment capability over a wide range of illuminance, it can effectively cover the test illuminance requirements from consumer-grade to most high-bit-depth cameras.
Recommended Test Chart:
Transmissive 36-Step High Dynamic Range Test Chart
This 36-step high dynamic range test chart has a contrast ratio of up to 30,000,000:1 (approximately 150 dB), which can meet the testing requirements of the vast majority of extremely high dynamic range imaging systems. Additionally, a polarizer is specially added at the center of the chart to adjust the amount of incoming light by filtering polarized light, which can more effectively reduce glare interference.
7. Maximum Illuminance
Metrics:
Under high illuminance environments, the image should display normally, without phenomena such as screen scrolling, screen tearing, moiré patterns, color cast, or image whitening.
Method:
The light source color temperature is D65 (range: 6500K ± 325K), and the illuminance shall be no less than 100,000 lx. The DUT is tested in operating mode B1 (i.e., the test specimen is normally electrically connected, all functions operate normally, and an external display device is required).
8. Minimum Illuminance
Metrics:
The MTF value shall meet the requirement of being no less than 60% of the MTF test metric, and there shall be no interference fringes, moiré patterns, or other such phenomena.
Method:
The test is conducted in a dark box (room). Under a D65 light source with an illuminance of (2 ± 0.2) lx, the DUT is tested in operating mode B1 according to the MTF value method, and image processing software is used to analyze the MTF values at the center field and 70% field.
9. Optical Axis Center Precision
Definition:
The deviation between the actual imaging center of the camera device and the theoretical center of optical imaging.
Metrics:
The measured value shall be within the range of (0 ± 2)°.
Method:
Set up the test equipment and the crosshair test chart as shown in the figure below, and test the DUT in operating mode B1.
 The test procedure is as follows:
a) Before the test, fix the DUT on the test bench and align the optical axis of the DUT perpendicular to the crosshair of the test chart;
b) The test chart should be within the depth of field of the DUT, and the optical axis should pass through the center of the test chart, with a stable image;
c) Using a video analysis device, measure the offset between the imaged position of the center of the test chart and the physical center of the DUT's image frame, and calculate the optical axis offset angle.
Solution:
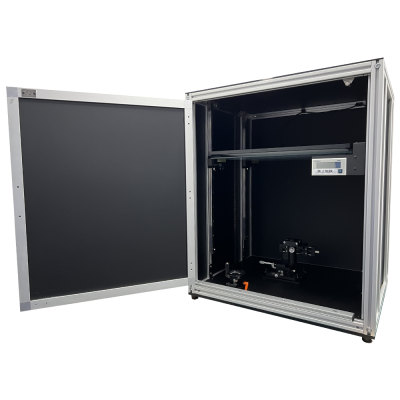
Camera Decentering Tester
10. Automatic Gain Control
Definition:
An automatic control method where the gain of the amplifier circuit is automatically adjusted according to the signal strength.
Metric:
The response time after switching between different light sources shall not be greater than 1s.
Method:
The DUT is tested in operating mode B1.
The test procedure is as follows:
a) Set up the DUT so that it outputs a standard video signal;
b) Rapidly switch the illuminance of the light source from (800±80) lux to (2±0.2) lux within less than 1s. Start timing after the switch is completed, and measure the time it takes for the video signal to change and stabilize using a video analysis device;
c) After an interval of 5s, rapidly switch the illuminance of the light source back to (800±80) lux within less than 1s. Start timing after the switch is completed, and measure the time it takes for the video signal to change and stabilize using a video analysis device;
d) Take the average of the two stabilization times as the test data.

11. White Balance
Definition:
The color reproduction of the image captured by photographic and video equipment of an object under different lighting conditions should match the color perception of the human eye observing the same object under the same lighting conditions.
Metric:
When photographing the neutral color patches of the 24-color test chart, there should be no obvious chromatic aberration, and the image should have no color cast. The saturation (S) value in the HSV color space for the #21 and #22 gray patches (the two middle patches) of the 24-color test chart should be less than 15%.
Method:
Set up the test equipment and the 24-color test chart as shown in the figure below, and test the DUT in operating mode B1.
The test procedure is as follows:
a) To ensure the proper functioning of the DUT's automatic white balance system, stray light entering the camera should be avoided;
b) The illuminance on the surface of the test chart is (800±80) lx, with color temperatures of 2800K, 4000K, and 6500K;
c) Adjust the distance between the DUT and the 24-color test chart so that the test chart occupies approximately 40% of the image frame area;
d) For DUTs with HFOV < 140°, select an area of no less than 32×32 pixels for each color patch and analyze it using image processing software;
For DUTs with HFOV ≥ 140°, select an area of no less than 10×10 pixels for each color patch and analyze it using image processing software.
Solution:
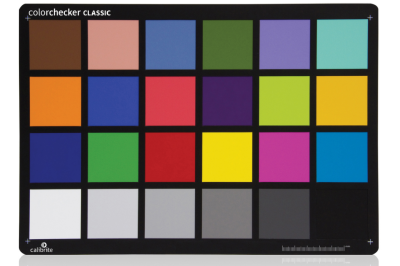
Recommended Chart:
Standard 24-Color Chart
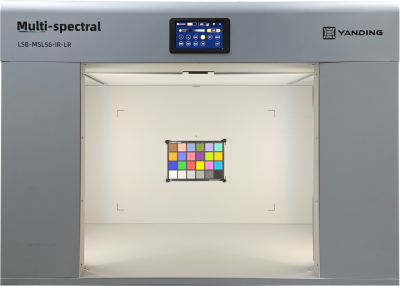
Recommended Light Source:
Multi-spectral Light Booth
Recommended Image Quality Analysis Software:
RIQA Image Quality Analysis Software
12. Startup Time
Metric:
The measured value shall not be greater than 1s.
Method:
The test procedure is as follows:
a) After adjusting the DUT to achieve normal framing, switch it to operating mode A2;
b) While switching the DUT's operating mode from A2 back to B1, use a video analysis device to record the DUT's power supply voltage signal and video output signal until the video signal reaches a steady state;
c) Extract the startup time ($t_{on}$ in the figure) on the video analysis device.

13. System Latency
Metric:
The measured value shall not be greater than 100ms.
Method:
The ambient illuminance shall not be greater than 2 lx, and the DUT is tested in operating mode B1.
The test procedure is as follows:
a) Use a white LED as the light source to uniformly illuminate the entire field of view of the DUT under test and the reference sensor;
b) Turn on the reference sensor, and use an oscilloscope to record the waveform of Signal 1 (reference sensor);
Turn on the light source, and extract the time difference between Signal 1 and Signal 2 (DUT) as the system latency ($t_{SL}$ in the figure).
Note 1: A Si PIN photodiode is recommended for the reference sensor, with a response time of no more than 5 µs, so its impact on the test results is negligible.
Note 2: The analog bandwidth of the dual-channel oscilloscope should be greater than 100 MHz (sampling rate greater than 0.5 GSamples/sec).
14. Color Rendition
Definition:
Mapping the image data describing the color space coordinates of a scene to output-related image data describing the color space coordinates of a photograph.
Metric:
The Euclidean distance of the measured error between the color patches and the white patch shall not be less than 0.02.
The hue angle shall meet the following requirements:
The coordinates of the red patch shall be within the range of (0°, 44.8°) or (332.2°, 360°);
The coordinates of the green patch shall be within the range of (96.6°, 179.9°);
The coordinates of the blue patch shall be within the range of (209.9°, 302.2°);
The coordinates of the yellow patch shall be within the range of (44.8°, 96.6°).
Method:
Based on the X-Rite 8-color test chart or an equivalent test chart, the DUT is tested and calculated in operating mode B1.
The test procedure and calculations are as follows:
a) The test shall be conducted after the DUT has completed auto white balance;
b) The test is conducted under illumination conditions of D65 light source, TL84 light source, and A light source, and the illuminance on the surface of the test chart shall be (800±80) lx, (200±20) lx, and (25±2.5) lx, respectively;
c) Adjust the framing of the DUT so that the edges of the test chart coincide with the edges of the field of view;
d) Analyze the chromaticity coordinates of each color patch captured by the DUT using a video analysis device;
e) Calculate the hue angle between each color patch (i=R, G, B, Ye) and the white patch in the image according to the following formula:
$$\theta_{\text{icolor}} =
\begin{cases}
\arctan\left( \dfrac{v'_{ti} - v'_{tr}}{u'_{ti} - u'_{tr}} \right) + \pi \times 180^\circ, & u'_{ti} - u'_{tr} \geqslant 0 \text{ 且 } v'_{ti} - v'_{tr} \geqslant 0 \\
180^\circ + \arctan\left( \dfrac{v'_{ti} - v'_{tr}}{u'_{ti} - u'_{tr}} \right) + \pi \times 180^\circ, & u'_{ti} - u'_{tr} < 0 \text{ 且 } v'_{ti} - v'_{tr} \geqslant 0 \\
180^\circ + \arctan\left( \dfrac{v'_{ti} - v'_{tr}}{u'_{ti} - u'_{tr}} \right) + \pi \times 180^\circ, & u'_{ti} - u'_{tr} < 0 \text{ 且 } v'_{ti} - v'_{tr} < 0 \\
360^\circ + \arctan\left( \dfrac{v'_{ti} - v'_{tr}}{u'_{ti} - u'_{tr}} \right) + \pi \times 180^\circ, & u'_{ti} - u'_{tr} \geqslant 0 \text{ 且 } v'_{ti} - v'_{tr} < 0
\end{cases}$$
Calculate the Euclidean distance between each color patch (i=R, G, B, Ye) and the white patch in the image according to the following formula:
$$R_i = \sqrt{(v'_{ti} - v'_{tr})^2 + (u'_{ti} - u'_{tr})^2}$$
Where: $v'_{ti}$ and $u'_{ti}$ are the measured values of color patch i (i=R, G, B, Ye); $v'_{tr}$ and $u'_{tr}$ are the measured values of the white patch; $R_i $ is the Euclidean distance.
Solution:
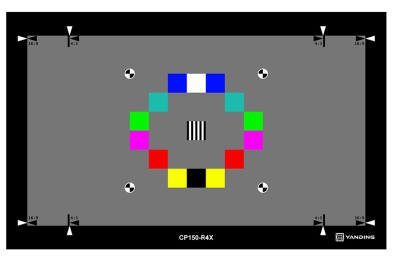
Recommended Test Chart:
Recommended Light Source:
多色温LED补光光源
15. Glare
Definition:
Visual conditions caused by inappropriate luminance distribution in the field of view, with extreme luminance contrasts in space or time, resulting in visual discomfort and reduced object visibility.
Metric:
The area of the light spot generated by the lens under test illumination shall not be greater than 25% of the display area.
Method:
Set up the test equipment and a full-black test chart as shown in Figure 9, and test the DUT in operating mode B1 inside a dark chamber.
The test procedure is as follows:
a) When no light source is applied, the luminance of the full-black test chart shall be less than $2\text{cd/m}^2$;
b) The light source shall be (5~10) $\text{Mcd/m}^2$, occupying (30~34) $\text{arcmin}$ in the field of view;
c) Ensure the light source is within the field of view of the DUT, and adjust the incident angle of the light source to maximize the area of the light spot in the image;
d) Using a video analysis device, calculate the area occupied by the region where the signal intensity is greater than 50% of the maximum intensity in the image, and calculate the ratio of this area to the total image area.
Solution:
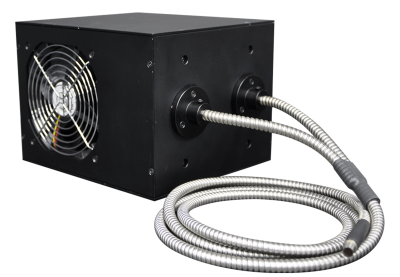
眩光光纤点光源
16. Ghost
Definition:
An additional image formed on the final image due to rapid internal reflections within the lens from a high-luminance target source present in the environment.
Metric:
The area ratio of the ghost image to the field of view shall meet the following requirements:
a) If the peak luminance ratio of the ghost image to the original image is greater than 50%, the area ratio of the ghost image to the field of view shall be less than 1%;
b) If the peak luminance ratio of the ghost image to the original image is greater than 30% and not greater than 50%, the area ratio of the ghost image to the field of view shall not be greater than 8%;
c) If the peak luminance ratio of the ghost image to the original image is not greater than 30%, there is no requirement for the area ratio of the ghost image to the field of view.
Method:
The point light source has a power of 1W, a color temperature of 6000K, a luminous angle of (110+10)° (half-intensity), and an illuminance of (220+22) lx. The DUT is tested in operating mode B1 inside a dark chamber.
The test procedure is as follows:
a) The distance from the DUT lens to the light source is (400±10) mm. The lens is fixed on a rotating stage facing the light source directly, and the image is confirmed to be normal;
b) Rotate the DUT clockwise in the horizontal direction, with the rotation center at the geometric center of the lens. The images after each rotation are separated by 10% of the horizontal field of view, until the light source exceeds the 40% region of the horizontal field of view, and save the images for each field of view;
c) Reposition the DUT to face the light source directly, and rotate it counterclockwise in the horizontal direction. The images are separated by 10% of the horizontal field of view until the light source exceeds the 40% region of the horizontal field of view, and save the images for each field of view;
d) Statistically analyze and calculate the area ratio and luminance ratio of the ghost image in the images of each field of view.
Solution:
鬼影光源