 This page is not fully translated, yet. Please help completing the translation.
(remove this paragraph once the translation is finished)
ISO 15739: Noise Measurements
Overview
The ISO 15739 standard specifies the test methods for noise and dynamic range of digital cameras.
Standard:
ISO 15739
Photography — Electronic still-picture imaging — Noise measurements
Technical Committee:
Terms and Definitions
Camera Opto-Electronic Conversion Function (OECF): The relationship between the logarithmic luminance of the input scene and the pixel values of an opto-electronic digital imaging system.
Digital Still Camera (DSC): A camera that produces digital still images from the digitized output of a solid-state photographic sensor and records the digital still images using digital storage media (such as removable memory cards).
Clipping Value: The pixel value that remains constant when exposure is further increased (highlight clipping value) or remains constant when exposure is further decreased (shadow clipping value).
Total Noise: All unwanted variations in the digitized output values captured from a single exposure, including pattern noise and temporal noise.
Noise: Unwanted variations in the response of an imaging system.
DSC Dynamic Range: As specified in ISO 15739, the ratio of the maximum exposure level at which the pixel value is below the highlight clipping value to the minimum exposure level that can be captured with an incremental signal-to-noise ratio of at least 1.
Visual Noise
Visual Noise (VN) refers to the perceived level of noise in an image by human observers, aligning with the perceptual characteristics of the human visual system.
The core difference between Visual Noise (VN) and Signal-to-Noise Ratio (SNR) is that: SNR reflects the objective total amount of noise, whereas VN is weighted by noise visibility, excluding noise imperceptible to the human eye.
Annex B of the standard provides a method for measuring the visual noise level.
The calculation principle is shown in the figure below:

Signal-to-Noise Ratio
Annex D of the standard describes the calculation method for the signal-to-noise ratio.
The calculation formula is as follows:
For each gray patch ${L_{j}}$, calculate the system's luminance gain $g(L_{j})$:
$$ g(L_{j}) = \frac{1}{2} [ \frac{ I(L_{j})-I(L_{i}) } {L_{j}-L_{i} } + \frac { I(L_{k}) - I(L_{j}) } {L_{k}-L_{j}} ] $$
where $I(L_{j})$ is the pixel value corresponding to the luminance $L_{j}$, and $L_{i}$ and $L_{k}$ are the luminance values of the patches adjacent to $L_{j}$.
The signal-to-noise ratio is calculated as: $$ Q_{total} = \frac{ g(L_{j})* L_{j} }{ \varrho_{total} } $$
where $L_{j}$ is the luminance of the target patch; $\varrho_{total}$ is the total noise of the target patch.
Test Chart
The test chart used is based on the test chart described in ISO 14524 (see Figures 1, 2, and 3), and can be either transmissive or reflective. The chart must have a sufficient density range to ensure that when the background of the test chart is at the specified code value, the luminance of the lightest gray patch is not lower than the camera's highlight clipping threshold. Typically, this requires the use of a high-contrast transparent chart with backlighting. It is recommended to use a high-contrast transmissive 20-patch OECF test chart with a contrast ratio of 10,000:1.
 |  |  |
| Figure 1: 12-step OECF test chart | Figure 2: 16-step OECF test chart | Figure 3: 20-step OECF test chart |
DSC Test Environment Setup
The method for measuring noise depends on the camera type and its level of automatic exposure control. Here, the environmental setup for the test chart is introduced using a TTL auto-exposure camera without manual exposure control override as an example.
 |
| Test environment for transmissive test chart |
 |
| Test environment for reflective test chart |
Illumination Adjustment
For cameras using 8-bit per channel sRGB encoding, the light source brightness level must be adjusted so that the pixel value of the central background of the OECF test chart in the ISO 14524 standard falls within the range of 110 to 130 (target value is 118).
How to Measure Noise?
Test Equipment
According to the test procedures and algorithms of the ISO 15739 standard, the recommended test equipment for noise measurement includes a transmissive light box, an OECF test chart (the CP180-TI-120 transmissive 20-step gray scale test chart from Yanding is used here), and RIQA image quality analysis software.
| Equipment Name | Yanding TLB Series Transmissive Light Box | CP180-TI-120 Transmissive 20-Step Gray Scale Test Chart | RIQA - Camera Module |
| Test Equipment | 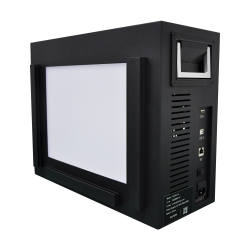 | 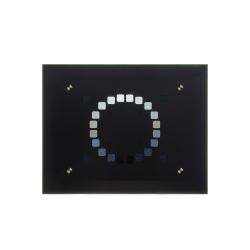 |  |
| Equipment Function | Provides uniform and stable standard illumination | Gray scale test target | Analyzes test images and calculates noise-related metrics |
Result Interpretation
RIQA is an image analysis software independently developed by Yanding. Its Camera module supports noise measurement according to the ISO 15739 standard, and can calculate the Signal-to-Noise Ratio (SNR) and Visual Noise (VN) from multi-step gray scale test charts, objectively quantifying the camera's noise level.

Visual Noise
VN line chart and its corresponding data calculated with reference to the ISO 15739:2017 standard.

Signal-to-Noise Ratio
SNR curve chart and its corresponding data calculated with reference to the ISO 15739:2017 standard.
