 This page is not fully translated, yet. Please help completing the translation.
(remove this paragraph once the translation is finished)
Dynamic Range
I. What is Dynamic Range
Dynamic Range (DR) For image signals, it refers to the ratio of the maximum to the minimum value of the variable signal; it is used to describe the maximum luminance range from the darkest to the brightest areas of a real scene that an imaging device can simultaneously record. It is commonly measured in decibels (dB), exposure values (EV), or f-stops.

Observe the left and right parts of the figure below. Which visual effect do you prefer? Most people would probably lean towards the left half. Why? The left half is bright with rich tonal levels; the textures of the snow-capped mountains, the colors of the grass, and the reflections on the water are all clear and delicate. The right half, however, looks grayish and hazy, with details and textures far inferior to the left. The core reason behind this is the difference in dynamic range—the larger the dynamic range, the higher the contrast of the image, and the richer the light and dark levels and color details, naturally resulting in a better visual experience.

High Dynamic Range (HDR) is a technology that expands the luminance range to solve the problems of overexposed highlights and underexposed shadows, achieving simultaneous retention of light and dark details in a scene. It can significantly enhance image contrast and realism. When the lighting difference in a scene is significant, insufficient dynamic range will either cause overexposure due to excessively bright scene lighting or underexposure due to excessively dark scene lighting, leading to a loss of image details. HDR technology can effectively avoid this problem and restore richer visual levels.

High dynamic range (HDR) imaging can be achieved through a combination of various technical elements:
- HDR Technology: Expands the luminance capture range through HDR imaging technologies such as high-sensitivity sensors (sacrificing resolution for light capture), temporal multi-frame (not supporting moving scenes), and large-small pixel HDR (which may produce color artifacts);
- High-Quality Optical Components: Adds anti-reflective coatings to lens elements, lens barrels, and camera bodies, or uses lens hoods to reduce stray light interference;
- Image Encoding: Based on high bit depth (≥16 bits) and companding technology, combined with formats like HDR10/Dolby Vision/HLG to achieve efficient storage and transmission of luminance information;
- Display / Printing: Relies on HDR displays and dedicated HDR transparencies to complete the final presentation of wide dynamic range content.
II. Factors Affecting Dynamic Range Testing
There are the following factors strongly correlated with the measurement accuracy of the dynamic range (DR) of an imaging system:
1. Stray light plays a dominant role in affecting dynamic range measurements. Stray light affects the dynamic range measurement of the entire image (see the figure below). Stray light is flare generated by reflections between lens elements, which will “swamp” dark area details, causing the camera system DR to be much lower than the sensor's nominal value (e.g., the sensor can reach 150dB, but the actual camera is only 70-90dB). Stray light may also be misjudged as test chart signals, leading to falsely high DR measurements (e.g., some low-quality cameras even measure a false value of 148dB).

2. The design of the test chart determines the size of the glare caused in bright areas. The larger the bright area, the greater the glare, and the lower the measured dynamic range data. This means it is impossible to have a perfect test chart suitable for all conditions.
3. Exposure also has a critical impact on dynamic range (DR) measurements. Overexposure will cause dark patches to turn gray due to glare spreading from saturated color patches, destroying the accuracy of DR measurements. Therefore, “good exposure” must be controlled (saturated color patches ≤ 1-2).
4. Reflections also have a severe impact on DR measurements. It is recommended to cover all potentially reflective objects near the camera with black velvet, except for the lens.
III. Test Equipment
In dynamic range testing, a standardized environment can be set up in the laboratory using standard light sources to capture dedicated dynamic range test charts. After analysis by image quality analysis software, the dynamic range (DR) is used as an objective indicator to evaluate the dynamic range performance of the imaging system.
Common Dynamic Range Test Charts:
Transmissive Test Charts:
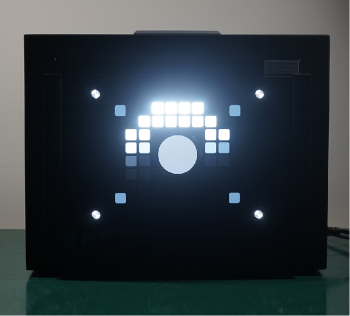
Transmissive 36-step grayscale test chart (up to 150dB), transmissive 20-step grayscale test chart (up to 120dB), etc.
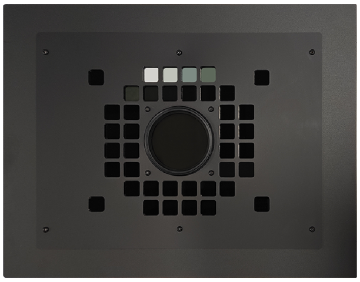 | 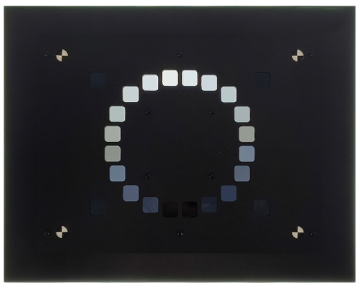 |
| 36-step high dynamic range test chart (150dB/adjustable light input) | 20-step grayscale high dynamic range test chart (120dB/adjustable light input) |
|---|
Unlike traditional charts, a polarizer is added to the center of the chart, which can effectively reduce glare interference. Its multi-level grayscale characteristics support fine luminance grading, meeting the needs of higher dynamic range testing. Therefore, the transmissive 36-step grayscale test chart is recommended for dynamic range testing.
Reflective Test Charts:
Reflective 12-step grayscale test chart, reflective 24-step grayscale test chart, Q14 grayscale test chart, etc.
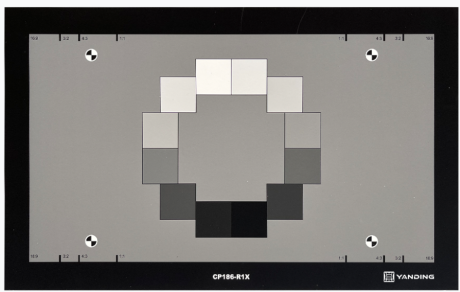 | 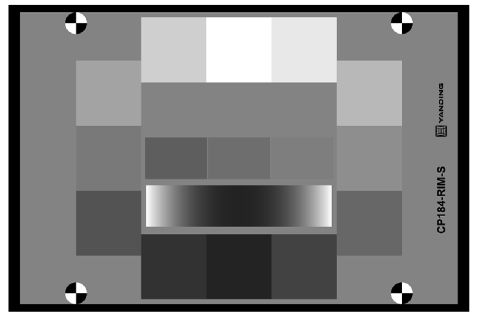 | 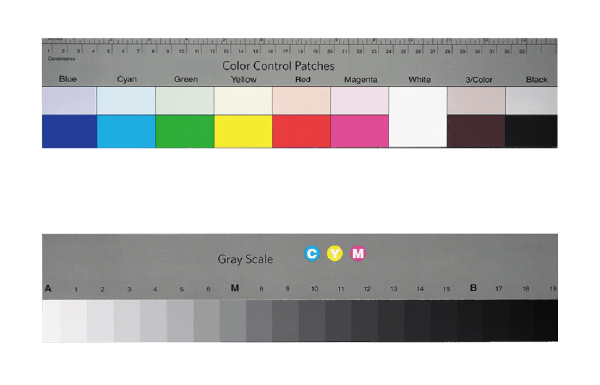 |
| 12-step grayscale chart OECF (ISO 14524 standard test) | CP184-RIM-S test chart (ISO-15739) | TC-RQ-14 reflective grayscale chart |
|---|
However, in dynamic range testing, reflective test charts are generally not recommended because they are highly susceptible to ambient light interference and have a limited number of grayscale patches. The grayscale density cannot meet the testing requirements for higher dynamic ranges.
Other Equipment:
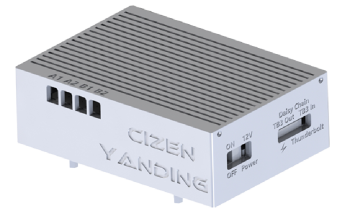
IV. Test Methods
(Taking the standard test method of “QC/T 1128-2019: Cameras for Automobiles” as an example to explain the test process)
1. Environment Setup:
In a dark environment, insert the transmissive 36-step grayscale test chart into the transmissive light box and adjust the brightness of the light box source. It is necessary to ensure that the G value of the 18% gray patch area in the output OECF chart is between 110-130 (118 is recommended), and the backlight luminance uniformity is not less than 90%. The light source color temperature is taken as 5000K here as an example.
Precautions: Be careful to avoid stray light and reflections when shooting. It is recommended to cover all potentially reflective objects near the camera with black velvet.
2. Sample Capture:
Use a fixture to secure the module, select an appropriate shooting distance according to the focal length of the module, and use an image capture card and image acquisition software to capture test samples.
3. RIQA Analysis:
(1) Open the RIQA software, select OECF 36-Patch in the grayscale module, select the corresponding chart type in the lower left corner, and click “Modify Reference Value File” to import the grayscale reference value file corresponding to the captured chart.

 (2) Click the “+ Add” button to import the image to be tested, and click the “Start” button to begin testing.
 (3) “Select Analysis Area” appears in the middle area of the software, and the default ROI area will appear. The “Image Enhancement” function can be used to assist in adjusting the ROI area. After adjusting the ROI area, click the “Next” button.
 (4) Drag the small red square to fine-tune the ROI area to ensure the detection area is correct. If there are images in the same group that need to be tested, you can click “Save Layout” to save the adjusted ROI layout. After the ROI area adjustment is completed, click “Analyze” to perform the detection.
 (5) The graph in the middle area of the software shows curves such as DR. Below are the test results of the image. “1 (LOW)” and “ISO Dynamic Range (dB)” correspond to the dynamic range test results of different algorithms. Right-click the image in the upper right corner to view the naming order of the ROI areas. Click the “Generate Report” button.
 (6) Jump to the report generation interface, select the format of the output file, enter the file name and file save address, and click the “Export” button. After the report is successfully generated, a prompt will indicate that the report was generated successfully.

4. Result Interpretation:
 Read the DR value corresponding to SNR=1.
According to the “QC/T 1128-2019: Cameras for Automobiles” standard: the dynamic range of SD products should not be less than 60dB, and HD products should not be less than 85dB. The actual test results can be used to determine whether the camera's dynamic range performance meets the standard.
Read the DR value corresponding to SNR=1.
According to the “QC/T 1128-2019: Cameras for Automobiles” standard: the dynamic range of SD products should not be less than 60dB, and HD products should not be less than 85dB. The actual test results can be used to determine whether the camera's dynamic range performance meets the standard.
Why read the DR value at SNR=1?
Because SNR=1 is the physical lower limit where the signal and noise are critically distinguishable (below which there is no valid signal), it corresponds to the maximum luminance span of the camera from the “bright area (unsaturated) to the dark area (critical signal)”, which is the theoretical limit DR. The DR values at SNR=2/4/10 (corresponding to medium/medium-high/high image quality) focus on filtering out areas where the signal can effectively suppress noise. A higher SNR requires higher signal purity and necessitates discarding dark areas with low signal-to-noise ratios, causing the lower limit of the dark area to shift upward. Since the upper limit of the bright area is fixed, the luminance span shrinks accordingly, which cannot reflect the camera's maximum luminance coverage limit at the physical level.
Difference Between Slope-Based DR and SNR-Based DR
In dynamic range metric analysis, some image quality analysis software will output both values simultaneously. The core differences between the two are as follows:
1. Slope-based DR: Only determines whether the slope of the density curve is within the valid range (reflecting the linearity of the signal response) without considering noise, which is prone to false high values. It is only applicable to ideal laboratory environments without tone mapping and with low stray light. It has no practical application reference value and is not recommended for standalone use.
2. SNR-based DR: Focuses on meeting the signal-to-noise ratio (ensuring the signal suppresses noise) and requires pixels to be unsaturated, which aligns with actual image recognizability and offers higher reliability. It is applicable to actual camera system measurements, can reflect image quality under different scene luminances, and is the mainstream reference metric in the industry.